

The costs that damage margins most are rarely the ones leadership argues about in budget meetings. They sit inside broad expense lines such as administration, technology, procurement and facilities, spread across dozens of processes and contracts, each too small to attract attention on its own. Hours spent re-keying data, software licences nobody uses, supplier contracts that renewed automatically at escalated prices and parallel teams doing the same work in different business units all look like the normal cost of operating. Leadership pursuing structural cost discipline therefore makes cost visibility part of Strategic Cost Optimization. Identifying hidden operational costs means examining how work, money and decisions actually move through the business, not only how expenses are classified in the ledger. The ledger records what was spent. It does not explain why.
What Makes an Operational Cost Hidden?
A hidden operational cost is an expense that is real and recurring but is not visible as a distinct item that someone is accountable for. It is usually hidden for one of three reasons.
First, it is aggregated. Financial reporting groups costs by nature, such as salaries, rent, software and professional fees, rather than by the activity they support. A manual reconciliation process that consumes the equivalent of four full-time employees appears simply as part of the finance department’s salary line.
Second, it is distributed. The cost is spread across many departments or contracts, so no single manager sees enough of it to act. Ten business units each paying for a slightly different project management tool is a material cost at group level and an immaterial one in each unit.
Third, it is normalised. The cost has existed for so long that it is treated as the way things are done. Approval chains with six signatures, monthly reports that nobody reads and supplier terms negotiated a decade ago fall into this category.
Individually, each item appears minor. Collectively, hidden costs can absorb a meaningful share of operating expenditure and weaken the return on every other investment the business makes.
Where Do Hidden Operational Costs Accumulate?
Hidden costs follow recognisable patterns across industries. Five sources account for most of them.
Process inefficiency. Manual approvals, re-keying of data between systems, reconciliation of figures that should agree automatically and rework caused by errors consume labour without creating value. Workflow analysis frequently finds steps that can be eliminated, automated or combined.
Supplier contract leakage. Contracts negotiated years ago may contain pricing that no longer reflects the market, automatic renewal clauses, annual escalators and minimum commitments for services that are no longer fully used. Invoices may not match contracted rates, and volume discounts may never be claimed.
Technology fragmentation. Business units that buy software independently create overlapping platforms, each with its own licences, support contracts, integrations and administrators. Systems that do not connect require manual work to move data between them, adding a labour cost to the licence cost.
Organisational duplication. Growth, acquisitions and decentralisation often produce parallel finance, procurement, HR and administrative teams performing the same tasks in different structures, with different processes and limited coordination.
Workforce friction. Time lost to excessive meetings, unclear reporting lines, slow decisions and roles that have drifted away from organisational priorities is a cost even when headcount is stable. It shows up as overtime, contractors and missed deadlines rather than as a line item.
Which UAE-Specific Costs Are Easily Missed?
Several costs are particular to operating in the UAE and are frequently understated because they are accrued, contingent or handled outside the finance function.
- Input VAT that cannot be recovered because supplier invoices do not meet tax invoice requirements, or because expenses relate to exempt activities, becomes a direct cost at the 5% rate.
- End-of-service gratuity accruals grow with every year of service and can become a significant liability in businesses with long-tenured staff, particularly where accruals are not reviewed against current salaries.
- Visa, work permit, medical insurance and related employment costs are often recorded across several cost centres, so the full cost of each hire is not visible to the manager who requested it.
- Multiple trade licences, free zone registrations and office leases maintained for entities that no longer trade actively continue to generate renewal fees and compliance costs.
- Corporate Tax compliance under Federal Decree-Law No. 47 of 2022 adds record-keeping and advisory costs that should be planned and centralised rather than absorbed separately by each entity.
How Can Hidden Costs Be Made Visible?
Hidden costs become visible only when financial data is connected to operational activity. Four analytical methods do most of the work.
Activity-Based Cost Analysis
Activity-based analysis reallocates expenses from accounting categories to the processes that consume them. It shows how much the business spends on order processing, supplier onboarding, month-end close or customer complaint handling, and therefore which activities consume resources out of proportion to their value.
Workflow Mapping
Workflow mapping traces how a piece of work moves through the organisation, step by step, recording time, handoffs, approvals and rework. Redundant approvals, waiting time and manual transfers become obvious once they are drawn.
Spend Analytics
Spend analytics consolidates purchasing data across entities, departments and suppliers. It reveals supplier fragmentation, duplicate contracts, off-contract purchasing and price variance for the same item, and it usually produces the fastest savings.
Contract Lifecycle Review
A contract register with renewal dates, notice periods, escalators and usage commitments prevents auto-renewals and price increases from passing unnoticed. Comparing invoices to contracted rates identifies overbilling.
| Cost Source | How It Hides | Best Detection Method | Typical Remedy |
|---|---|---|---|
| Process inefficiency | Absorbed in salary lines | Workflow mapping and activity costing | Remove steps, automate, consolidate |
| Supplier leakage | Spread across many invoices | Spend analytics and contract review | Renegotiate, consolidate suppliers, enforce rates |
| Technology fragmentation | Bought by separate departments | Licence and application inventory | Rationalise platforms, integrate systems |
| Organisational duplication | Embedded in unit structures | Activity costing across units | Shared services, single process owners |
| Workforce friction | Normalised as working practice | Time analysis and role review | Clear decision rights, fewer meetings, role redesign |
A Worked Example: Finding 6% of Operating Costs
Consider an illustrative UAE trading and logistics group with annual operating expenditure of AED 150 million across four entities. A twelve-week review produces the following findings.
A contract review identifies AED 2.4 million a year in automatic renewals, escalators above market and unused minimum commitments, mainly in facilities, IT support and freight forwarding. An application inventory finds 210 software subscriptions, 70 of which overlap, with consolidation saving AED 1.1 million a year. Workflow mapping of accounts payable shows each supplier invoice passing through eleven steps, including two manual re-keying stages, and redesign releases capacity equivalent to six roles, worth AED 1.8 million. Two dormant free zone entities are closed, removing AED 0.4 million in licence, lease and audit fees. Finally, improved invoice checking recovers AED 0.3 million of input VAT a year that had been lost to non-compliant supplier invoices.
The total is AED 6.0 million, or 4% of operating expenditure. A further AED 3 million of savings from merging two duplicated finance teams is identified but phased over eighteen months, bringing the total to 6%. None of these items appeared as a distinct line in the management accounts.
Original Analysis: The Hidden Cost Detection Matrix
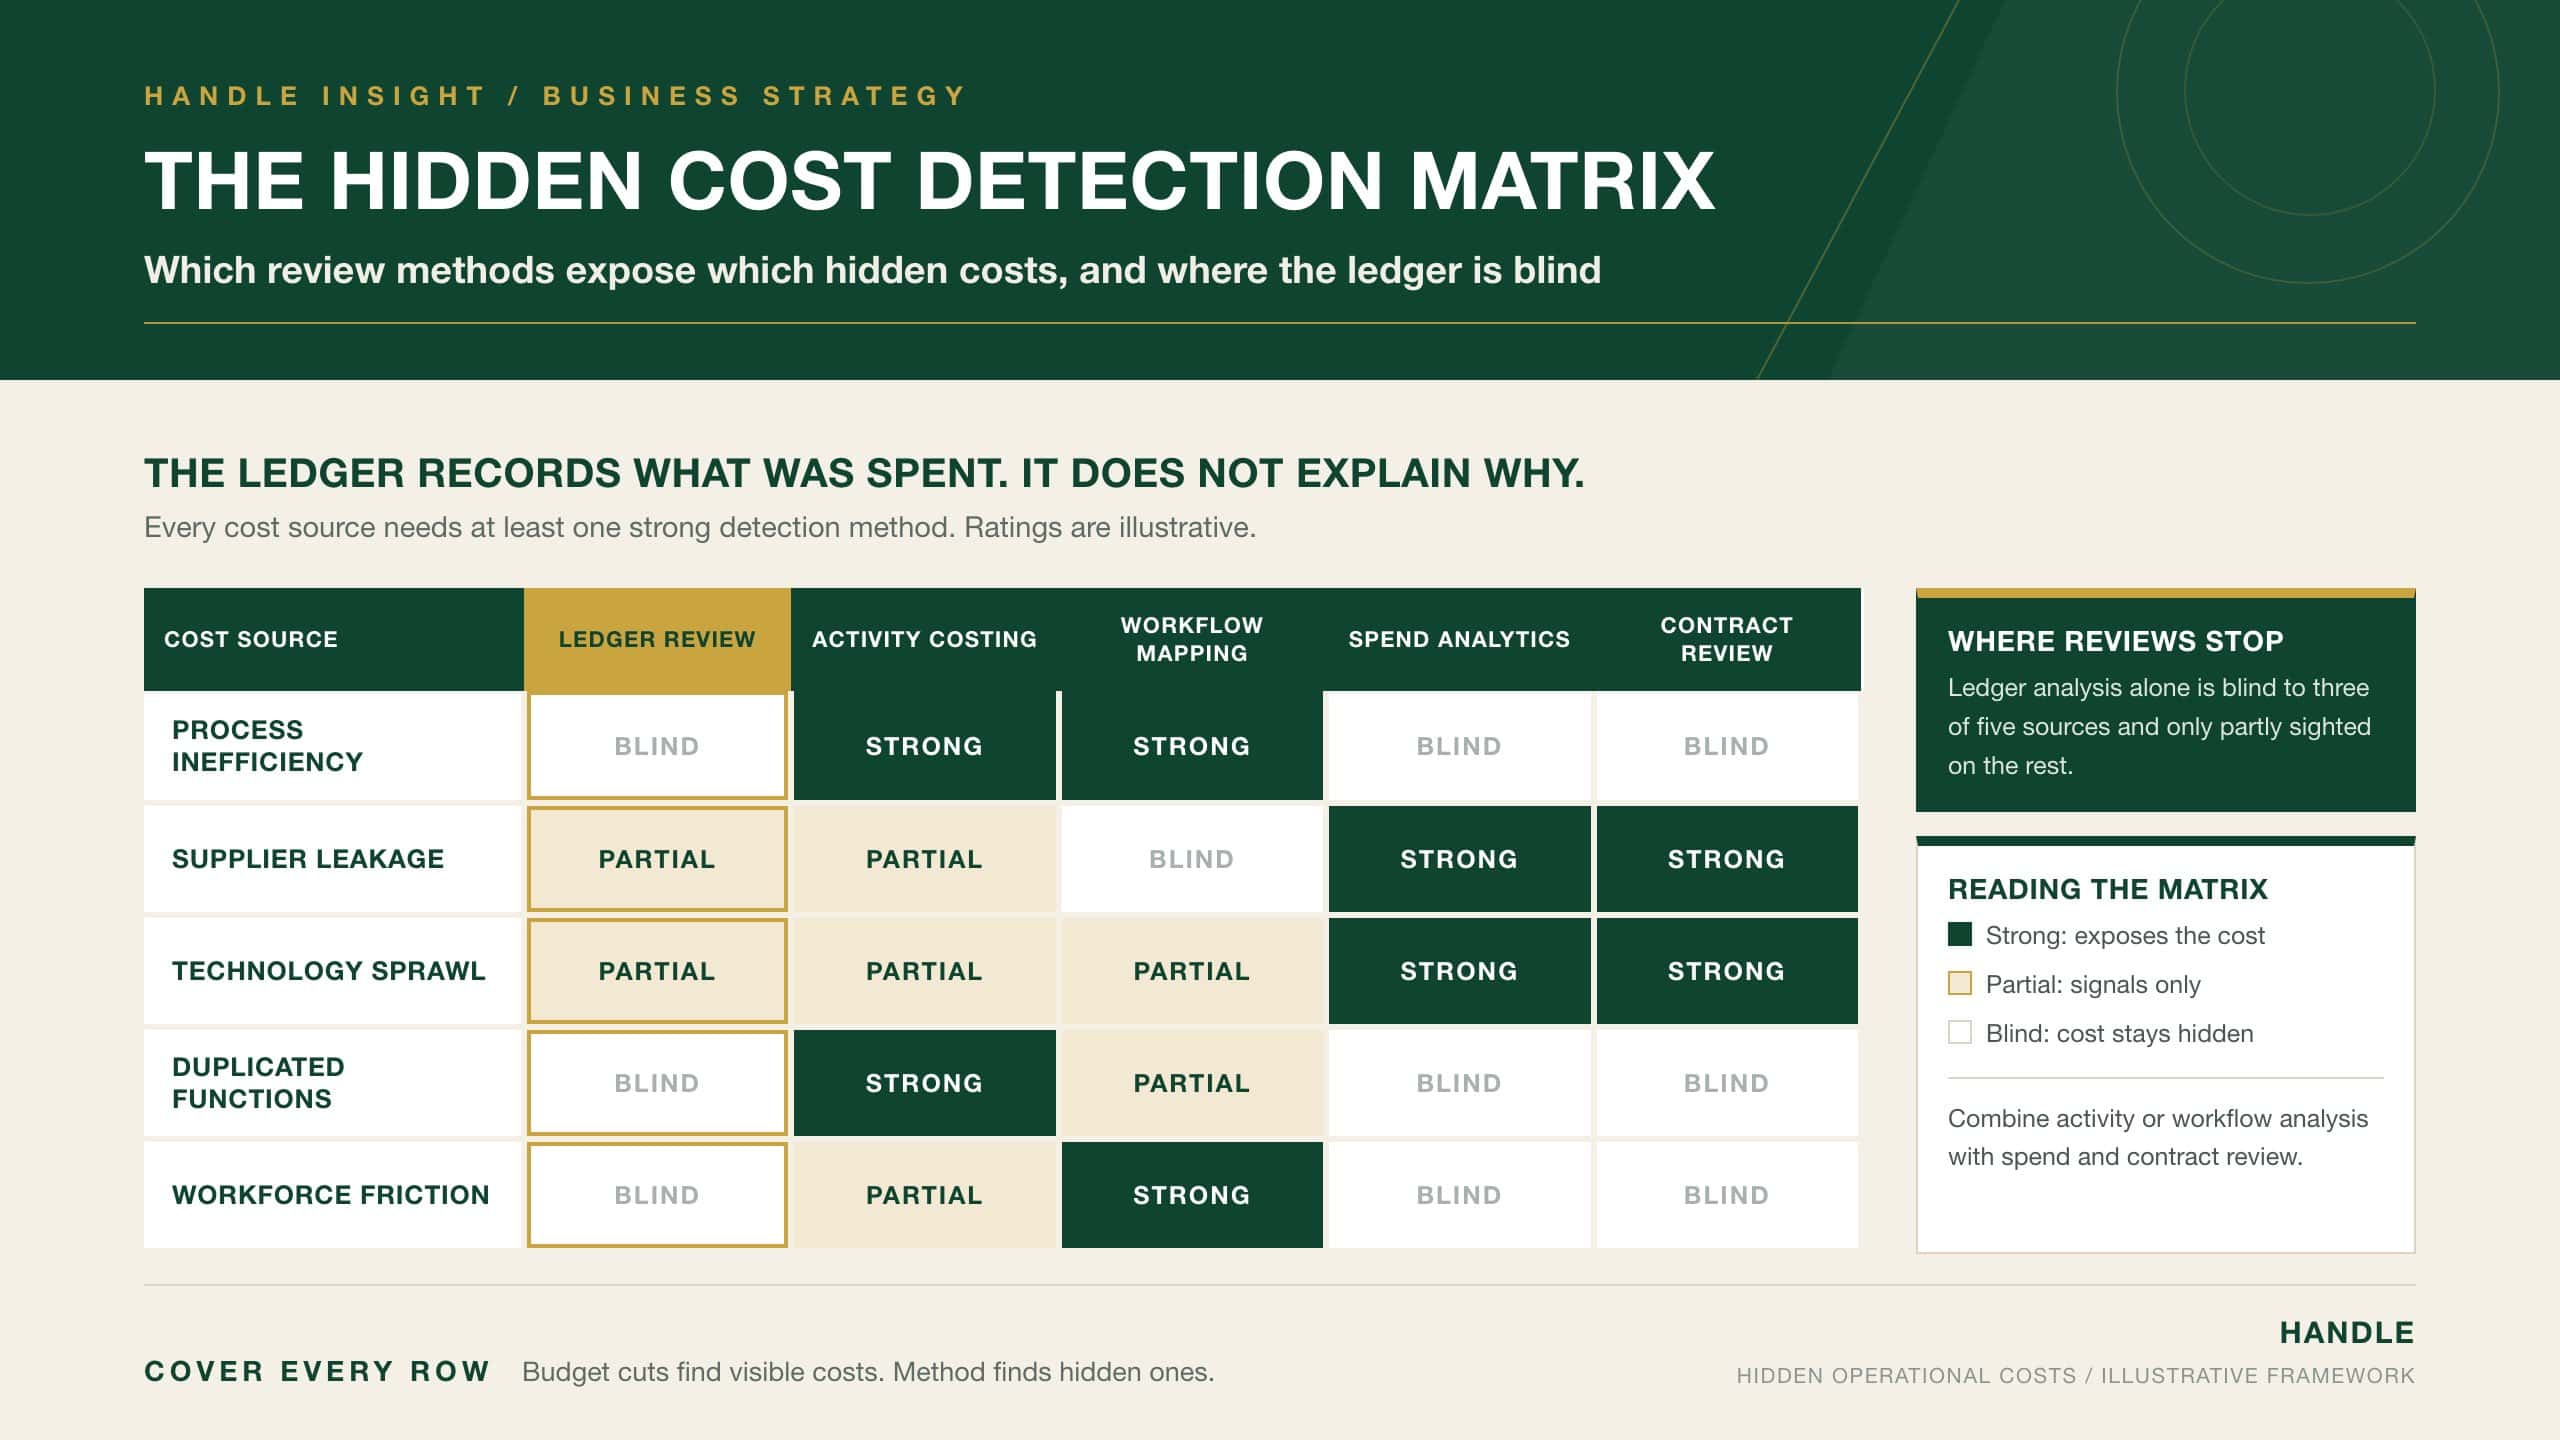
A practical way to search for hidden costs systematically is to test each cost source against each detection method, and to note where existing reviews are blind. The matrix below shows how well each method exposes each source.
| Cost Source | Ledger Review | Activity Costing | Workflow Mapping | Spend Analytics | Contract Review |
|---|---|---|---|---|---|
| Process inefficiency | Blind | Strong | Strong | Blind | Blind |
| Supplier leakage | Partial | Partial | Blind | Strong | Strong |
| Technology fragmentation | Partial | Partial | Partial | Strong | Strong |
| Organisational duplication | Blind | Strong | Partial | Blind | Blind |
| Workforce friction | Blind | Partial | Strong | Blind | Blind |
The matrix makes one point clear: a review that relies on the ledger alone is blind to three of the five sources and only partially sighted on the other two. Most cost programmes start and end with ledger analysis and budget cuts, which is why they find the visible costs and leave the hidden ones untouched. Covering every row with at least one strong method requires combining activity costing or workflow mapping with spend and contract analysis. The illustrative ratings are a starting point that each organisation should calibrate against its own systems.
How Do Hidden Costs Behave in Mergers and Acquisitions?
Acquisitions concentrate hidden costs. The combined business inherits two sets of supplier contracts, systems, administrative teams and entity structures. Integration planning that focuses on headline synergies can miss the smaller overlaps that, together, are often substantial. An operational cost review during integration, using the same matrix, ensures that duplicated contracts, licences and entities are identified while the organisation is already being redesigned. Integration is the one moment when contracts, systems and teams are reviewed in any case, so the marginal cost of looking for hidden costs is at its lowest.
How Is Cost Visibility Kept Permanent?
Identifying hidden costs once is not enough. Contracts renew, teams grow, new software is bought and processes accumulate approvals again. Without governance, most of the savings from a one-off review will erode within a few years.
Permanent visibility depends on assigning ownership and building review into the operating calendar. Each major cost category should have a named owner at group level, not only within each business unit. Procurement should hold a single contract register covering every entity, with notice dates monitored centrally so that no renewal happens by default. Technology purchases above a modest threshold should require approval from a central function that can check for overlap with existing platforms. Finance should produce activity-based cost views for the most resource-intensive processes at least annually, alongside the usual expense reports.
The board or audit committee also has a role. A short annual report on contract renewals, licence utilisation, dormant entities and process cost trends gives directors a view of structural cost that budget variance reports cannot provide.
| Control | Owner | Frequency | What It Prevents |
|---|---|---|---|
| Group contract register with notice alerts | Head of procurement | Continuous | Unplanned renewals and escalations |
| Licence utilisation review | Chief technology officer | Semi-annual | Paying for unused or overlapping software |
| Activity cost review of key processes | Chief financial officer | Annual | Process cost creeping back |
| Entity and licence rationalisation | Group legal and finance | Annual | Fees for dormant entities |
Common Mistakes in Identifying Hidden Costs
- Relying on budget variance analysis, which compares spending to plan but cannot show whether the plan itself contains waste.
- Cutting visible discretionary spending, such as training or travel, while leaving structural costs in contracts and processes untouched.
- Treating the review as a one-off exercise, so costs return within two or three years as contracts renew and teams grow.
- Reviewing each entity or department separately, which hides duplication that is visible only at group level.
- Counting time savings as cost savings without redeploying or reducing the capacity released, so the saving never reaches the margin.
- Ignoring UAE-specific accruals and compliance costs, such as end-of-service gratuity and irrecoverable VAT, because they sit outside operational budgets.
Hidden costs return wherever visibility lapses. Governance has to make it permanent.
Conclusion
Identifying hidden operational costs requires looking beyond how expenses are classified to how work, purchasing and decisions actually flow through the business. The largest hidden costs arise from process inefficiency, supplier contract leakage, technology fragmentation, organisational duplication and workforce friction, and in the UAE they are joined by irrecoverable VAT, end-of-service gratuity accruals, fragmented employment costs and dormant entities. No single method exposes them all. Ledger review sees only part of the picture; activity costing, workflow mapping, spend analytics and contract review must be combined so that every source is tested by at least one strong method. Savings must then be captured, not merely identified, by redeploying released capacity and renegotiating terms. Finally, visibility must be maintained through regular contract, licence and process reviews. Costs that are seen can be managed. Costs that are hidden simply compound.


