

More measurement does not produce more control. Beyond a certain point it produces less. Within KPI & Strategic Performance Tracking, avoiding KPI overload is the discipline of deciding what deserves leadership attention and, just as importantly, what does not. An overloaded framework presents dozens of indicators with equal weight, so the few that signal a real problem are lost among those that merely describe activity. Boards spend meetings reading dashboards instead of taking decisions, and accountability spreads so thinly that no one owns any outcome decisively. The remedy is not a better dashboard. It is a governance rule about which measures are admitted, who owns them, and what happens when they move. A KPI that triggers no decision is not a KPI.
What Is KPI Overload and Why Does It Matter?
KPI overload is the condition in which the number of indicators reviewed at governance level exceeds the capacity of leaders to interpret them, act on them and hold someone accountable for them. It is not defined by a single number. A focused business with one product line may struggle with twenty indicators, while a diversified group may govern effectively with a similar count spread across well-defined tiers.
The symptoms are more reliable than any count. Board packs grow each quarter. Meetings run out of time before reaching decisions. Discussions centre on explaining variances rather than correcting them. Different executives cite different indicators to support opposing conclusions. When asked what action a particular red reading would trigger, no one is sure.
The cost is real. Attention is the scarcest resource in any leadership team, and KPI overload spends it on reading rather than deciding.
Why Do Organisations Accumulate Too Many KPIs?
Overload is rarely designed. It accumulates through three predictable mechanisms.
The first is the belief that visibility equals control. Each new data source seems to offer better oversight, so it is added to the dashboard. In practice, visibility without prioritisation fragments attention, and leaders lose the ability to distinguish critical signals from background noise.
The second is weak governance. Where decision rights are unclear, teams add metrics to justify their performance, explain variances or defend their territory. Measurement becomes defensive. The number of KPIs grows precisely because authority is absent.
The third is legacy accumulation. Indicators are added for new initiatives, new regulations or new executives, but are rarely retired when those initiatives end. Without deliberate pruning, the framework grows by inertia.
What Happens When Governance Is Overloaded?
Overloaded frameworks fail in consistent ways, and each failure weakens control rather than strengthening it.
The first is decision paralysis. When a dashboard presents forty indicators with equal visual weight, leaders spend their time scanning and interpreting rather than deciding. Response slows at exactly the moment when growth or disruption demands speed.
The second is diluted accountability. When everything is measured, ownership becomes unclear. A single outcome may be tracked by four indicators owned by three departments, and when it deteriorates each owner can point to a measure that still looks acceptable. Explanation replaces correction.
The third is metric gaming. A large framework gives every team a choice of which indicators to emphasise. Favourable measures are presented prominently and adverse ones are footnoted. Over time, the conversation shifts from outcomes to presentation, and the board receives a picture that is accurate in detail but misleading in sum.
None of these failures is caused by poor data. They are caused by too much data competing for too little attention.
KPIs Versus Metrics: The Distinction That Prevents Overload
The single most useful step in avoiding KPI overload is to separate key performance indicators from operational metrics. Both are valuable. They serve different people and carry different consequences.
| Dimension | Key Performance Indicator | Operational Metric |
|---|---|---|
| Purpose | Governs outcomes, capital, risk and strategic execution | Improves day-to-day execution within a function |
| Audience | Board and executive leadership with decision rights | Managers and teams running the process |
| Threshold | Defined tolerance with escalation on breach | Targets and trends managed locally |
| Consequence | A breach triggers a specific decision or intervention | A deviation prompts local adjustment |
| Quantity | Strictly limited | As many as the function finds useful |
This distinction removes the main source of resistance to reduction. Teams fear losing insight when an indicator leaves the board pack. They do not lose it. The metric remains available to the people who use it. It simply stops competing for leadership attention.
The Governance Rule That Stops KPI Overload
One rule does most of the work: if a KPI does not trigger a decision, it does not belong in governance. Every indicator admitted to the board or executive dashboard should be linked to a specific decision or intervention that a breach would require. If leadership cannot state that action in advance, the indicator is excluded.
A second rule follows from the first. A KPI is admitted only when a named individual holds both responsibility for the outcome and authority to correct deviation. A measure with no empowered owner creates frustration, not control.
These rules are deliberately demanding. They convert the KPI framework from a reporting exercise into a set of standing commitments about what leadership will do when performance moves.
Original Analysis: The KPI Admission Ladder
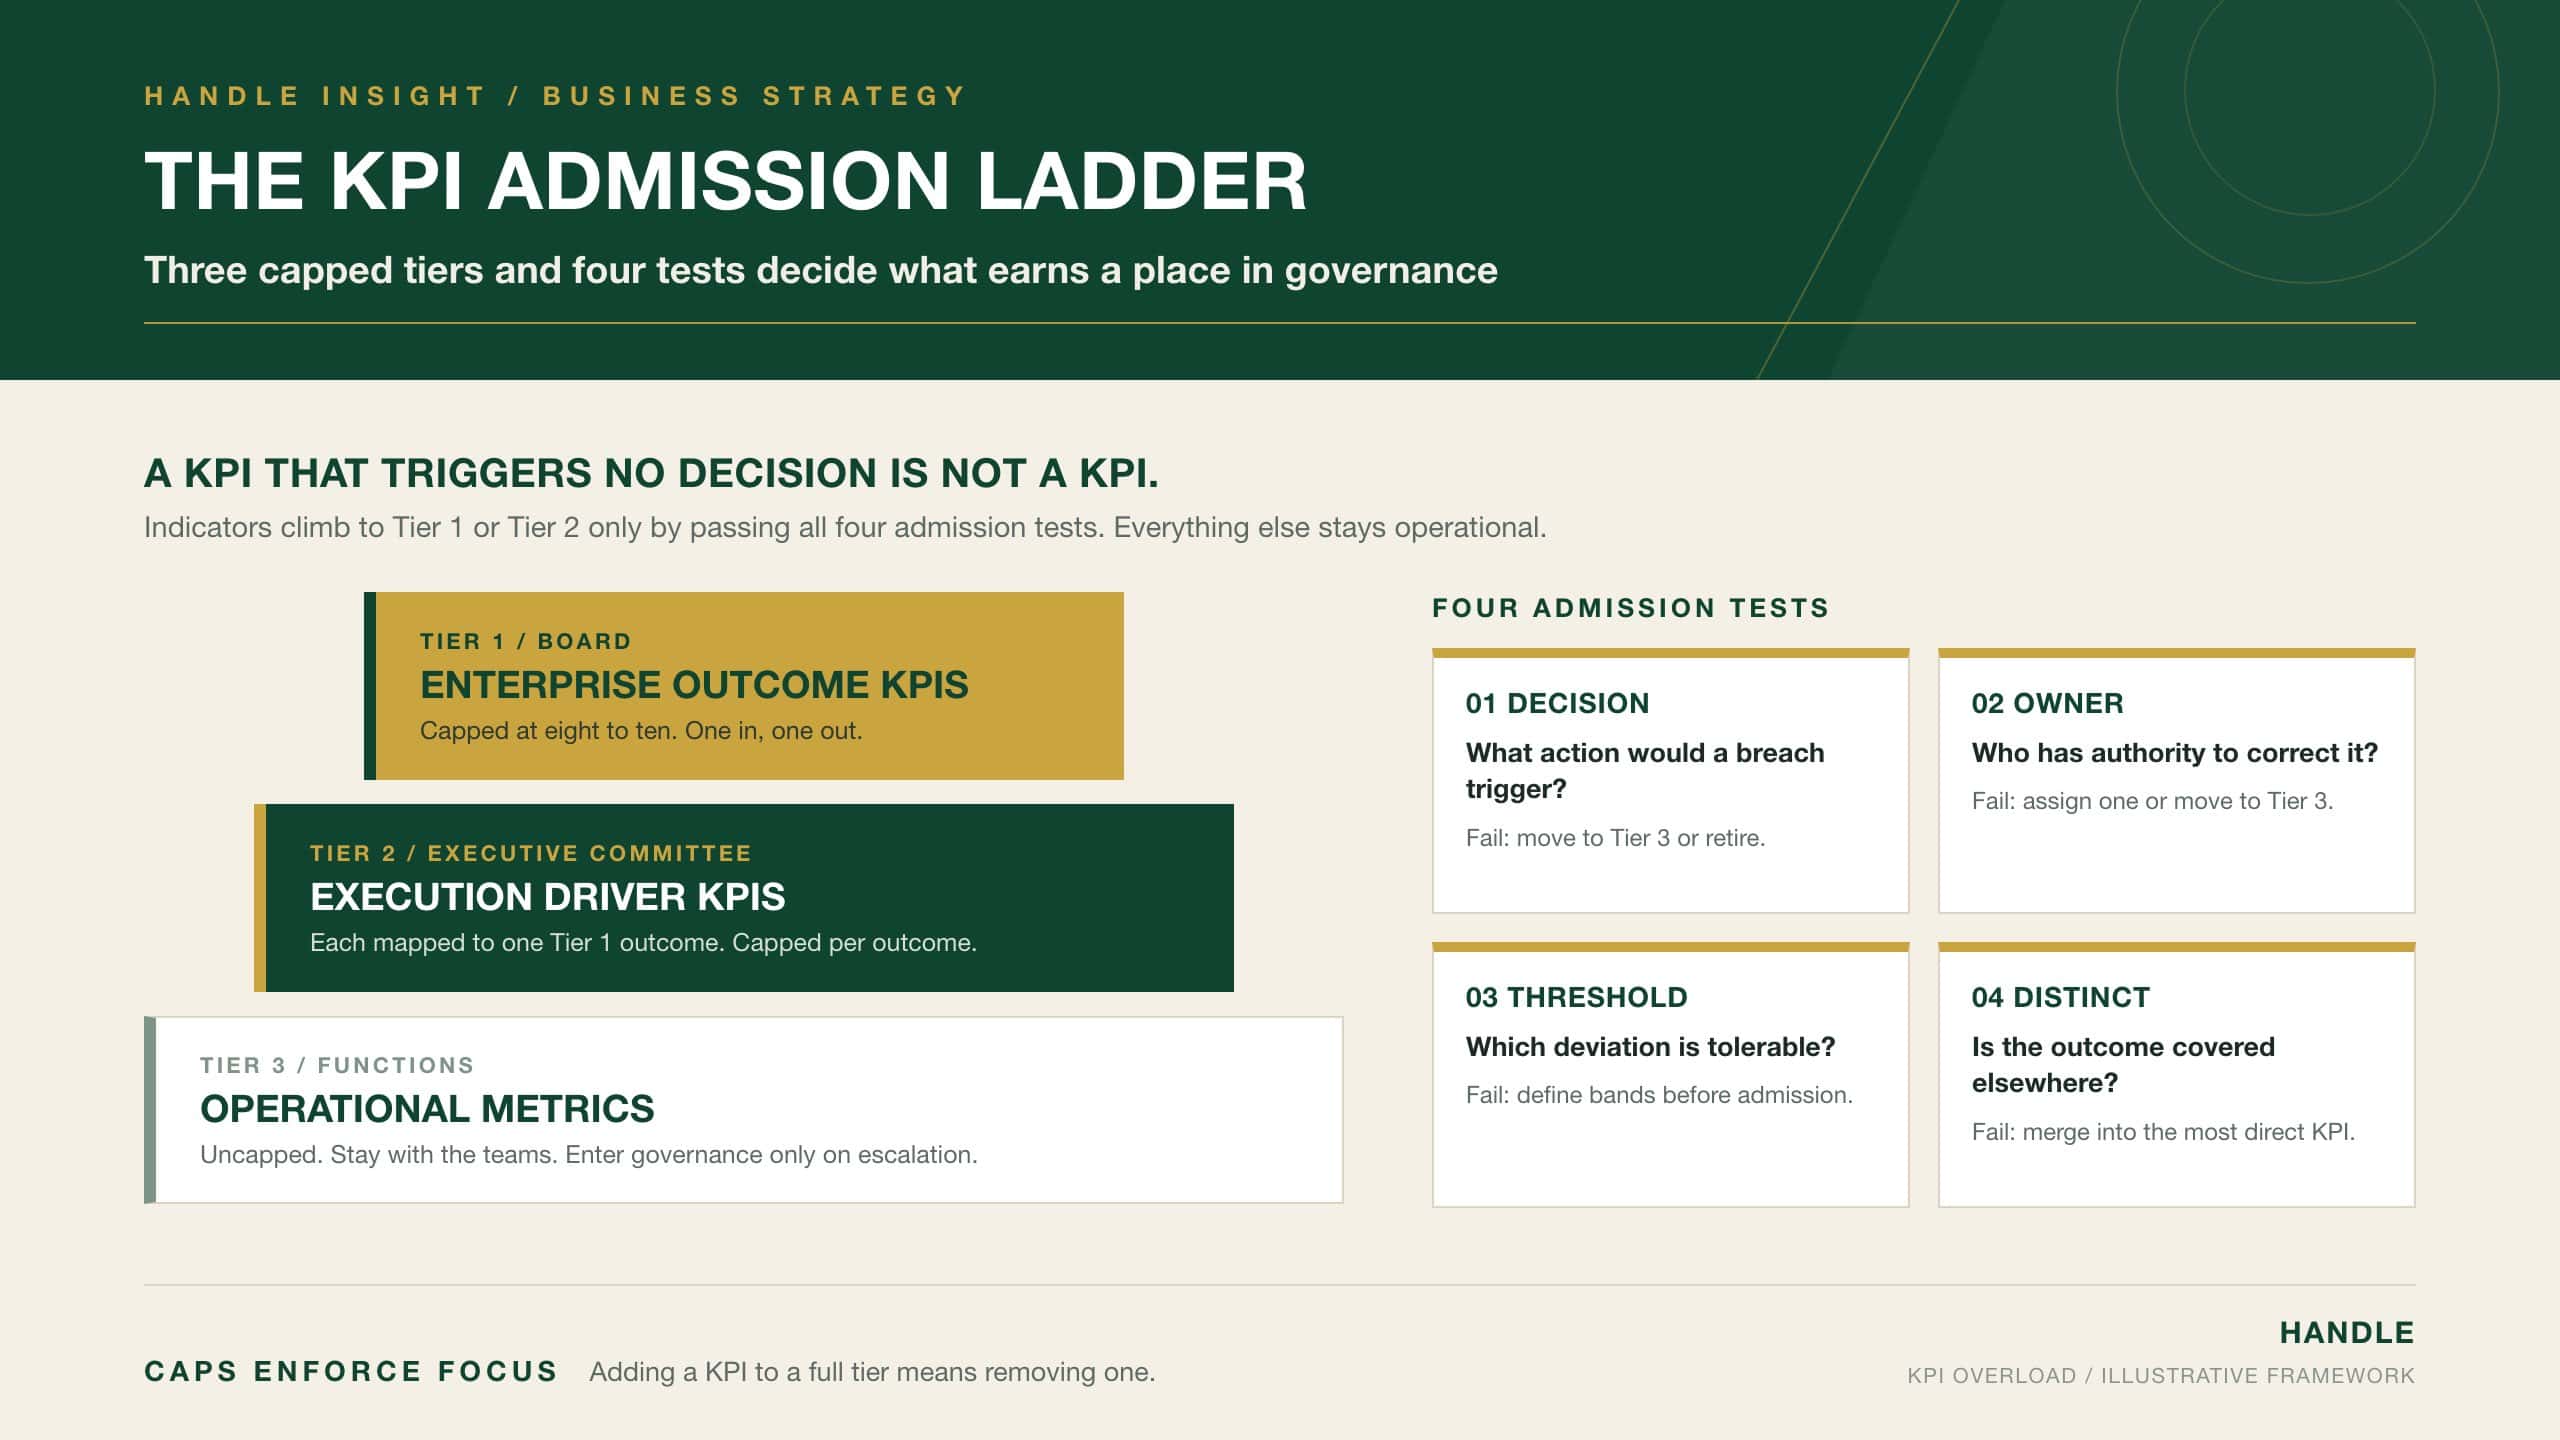
The KPI Admission Ladder combines a tiered structure with an admission test. It answers two questions for every indicator: does it deserve a place in governance at all, and if so, at which level?
The ladder has three rungs. Tier 1 holds enterprise outcome KPIs reviewed by the board, capped at a small number, typically no more than eight to ten. Tier 2 holds execution driver KPIs reviewed by the executive committee, each linked to a Tier 1 outcome and capped per outcome. Tier 3 holds operational metrics, which remain with the functions and do not enter governance unless they escalate.
Each Tier 2 driver should map to exactly one Tier 1 outcome. If a driver cannot be mapped, it is either an operational metric or evidence that the Tier 1 list is missing an outcome. Either way, the mapping exposes the gap.
To climb onto Tier 1 or Tier 2, an indicator must pass four admission tests.
| Admission Test | Question | If It Fails |
|---|---|---|
| Decision | What specific action would a breach trigger? | Move to Tier 3 or retire |
| Owner | Who has authority to correct the deviation? | Assign an owner or move to Tier 3 |
| Threshold | What level of deviation is tolerable, and what is not? | Define bands before admission |
| Distinct | Does it measure an outcome no other KPI already covers? | Merge into the most direct indicator |
The caps are what make the ladder hold. Each tier has a fixed number of places, and adding a new KPI requires removing an existing one. This one-in, one-out rule forces a conversation about relative importance every time someone proposes a new measure. Without it, the ladder slowly fills until overload returns.
A Worked Example: Rationalising a Board Pack
Consider an illustrative mid-sized services group whose quarterly board pack contains 74 indicators. Board meetings regularly overrun, and directors report that they cannot tell which numbers matter.
The group applies the four admission tests to every indicator.
| Outcome of Review | Number of Indicators | Destination |
|---|---|---|
| Failed the decision test | 24 | Moved to Tier 3 operational dashboards |
| Redundant with a more direct indicator | 11 | Retired |
| No owner with authority to correct | 8 | Moved to Tier 3 pending ownership |
| Passed all four tests: enterprise outcomes | 9 | Tier 1 board dashboard |
| Passed all four tests: execution drivers | 22 | Tier 2 executive dashboard |
| Total | 74 |
The board now reviews nine indicators, each with a threshold, an owner and a defined response. The executive committee reviews twenty-two drivers, each mapped to one of those nine outcomes. Forty-three indicators have left governance, but only eleven have actually been retired. The rest remain available to the teams that use them.
The figures are illustrative, but the pattern is common. Most of the reduction comes from the decision test, because many indicators were added to describe activity rather than to govern it.
How to Prune an Existing KPI Framework
Pruning should be a scheduled governance activity, not a one-off clean-up. A rationalisation review, held at least annually and whenever strategy changes, assesses each indicator against the four admission tests. Indicators tied to completed initiatives or superseded strategies are formally closed. Where several indicators measure the same outcome indirectly, the most direct one is kept and the proxies are retired.
Removal should be recorded as a decision, with a short rationale, so that the same indicator is not quietly reintroduced a year later. Temporary indicators, such as those monitoring a specific project or incident, should carry an expiry date when they are admitted.
New indicators should enter through a formal admission process rather than informal addition. A proposal should state the outcome measured, the owner, the threshold bands, the decision a breach would trigger and the existing KPI it replaces if the tier is full. The executive committee or board then admits or rejects it on the record. Informal additions are how overload begins.
How Should Dashboards Reinforce the Discipline?
Dashboard design can either protect the ladder or undermine it. Executive and board views should display only Tier 1 or Tier 2 indicators. Operational metrics can be one click away, but they should not sit on the primary screen.
Exception-based presentation helps further. Indicators within tolerance can recede visually, while those approaching or breaching thresholds are brought forward with the owner’s name and the pre-agreed response. This reduces the cognitive load on directors and directs discussion to the indicators that require a decision.
The dashboard should also show the date each KPI was admitted and when it was last reviewed. That simple field makes legacy accumulation visible.
Managing Resistance to Fewer KPIs
Resistance is predictable. Functional leaders may see the removal of their indicators from the board pack as a loss of status or a signal that their work matters less. The most effective response is structural rather than persuasive. Explain the distinction between KPIs and metrics, show that visibility is retained at Tier 3, and demonstrate that the indicators that remain carry real authority and consequence. Credibility follows behaviour. When leaders act decisively on a small number of indicators, the case for a short list makes itself.
Common KPI Overload Mistakes
- Equating measurement with management, so that the response to every problem is a new indicator rather than a clearer decision right.
- Admitting KPIs without a stated decision linkage, which fills dashboards with measures that inform but never trigger action.
- Allowing indicators to accumulate without periodic review, so the framework reflects past strategies rather than current ones.
- Keeping several proxies for the same outcome, which invites selective reporting of whichever proxy looks best.
- Assigning KPIs to committees or departments instead of named individuals, which diffuses accountability until no one owns the result.
- Designing indicators for reassurance, adding measures that make leadership comfortable rather than measures that would reveal a problem.
- Abandoning tier caps under pressure, which allows the ladder to refill one exception at a time.
Each of these mistakes reintroduces overload gradually. That is why avoiding it requires a standing rule, not an occasional effort.
Conclusion
Avoiding KPI overload is an exercise in governance discipline rather than dashboard design. The principle is simple: an indicator belongs in governance only if a breach would trigger a defined decision, a named owner has authority to correct it, its threshold is set in advance and it measures something no other KPI already covers. The KPI Admission Ladder applies that principle through three tiers with fixed caps and a one-in, one-out rule. Board attention stays on a small number of enterprise outcomes. Executive attention stays on the drivers of those outcomes. Operational metrics remain with the teams that use them. Pruning becomes routine rather than exceptional. Fewer indicators, carrying real consequence, give leadership more control than many indicators carrying none. Focus is a choice. Caps enforce it. Decisions prove it.


