

Every acquisition is underwritten on a thesis: new markets, lower costs, a capability the buyer could not build. Integration is where that thesis either becomes performance or quietly becomes a write-down. Defining KPIs for integration success is the work of turning the thesis into a small number of measurable commitments, assigning each to an owner, and reviewing them in a forum that can act. Within Integration Governance & Change Strategy, KPIs are the control system of the integration programme, not its scorecard. The common error is to measure activity, such as systems migrated or workshops held, instead of the value the deal was meant to create. Activity can be complete while value is missing. Measure the thesis, not the to-do list.
Why Integration Needs Its Own Measurement System
Integration programmes run dozens of initiatives at once across finance, operations, technology, people and compliance. Each workstream reports progress in its own language. Without a common framework, the steering committee receives a stack of status reports that are individually accurate and collectively unreadable.
Business-as-usual KPIs do not fill the gap. They measure the performance of the combined company, which is shaped by markets, seasonality and decisions unrelated to the deal. Integration KPIs isolate what the transaction was supposed to change and track whether it is changing. They give leadership three things: visibility of value realisation, alignment of workstreams to measurable targets, and early warning when performance drifts from the business case.
The test of an integration KPI is simple. If it turned red, would someone with authority do something different? If not, it belongs in a workstream report, not on the steering committee dashboard.
How to Derive KPIs From the Transaction Thesis
KPIs should originate in the investment case approved by the board. Each element of that case has a value, a timetable and an assumption about how it will be achieved. The integration KPI set restates those elements as measurable targets.
| Deal Rationale | Primary Outcome KPI | Leading Indicator | False Comfort to Avoid |
|---|---|---|---|
| Market expansion | Revenue from new regions or cross-sold customers | Qualified pipeline in target accounts | Number of joint sales meetings held |
| Cost consolidation | Run-rate cost synergies realised in the ledger | Synergy actions approved and implemented | Synergies identified in workshops |
| Capability or technology acquisition | Revenue or margin from the acquired capability | Retention of key technical staff; product release dates met | Systems integrated on schedule |
| Scale and procurement | Unit cost reduction on consolidated spend | Share of spend moved to renegotiated contracts | Number of suppliers contacted |
Each KPI needs a baseline, a target, a date and a definition agreed with finance. A synergy that is not defined before closing will be defined generously after it.
How Many KPIs Should an Integration Track?
Fewer than most programmes use. A steering committee can act on perhaps ten to fifteen outcome and leading indicators. Beyond that, attention fragments and the dashboard becomes a reporting exercise. Workstreams will track many more metrics internally, and they should, but only those that explain movement in a steering committee KPI should be escalated.
A practical structure is a three-level hierarchy. At the top sit four or five thesis KPIs that the board would recognise from the investment case. Below them sit the leading indicators that predict each thesis KPI. Below those sit workstream metrics that the integration management office monitors but does not report upward unless they breach a threshold. The hierarchy keeps the board focused on value, the steering committee focused on drivers and the workstreams focused on delivery.
Every KPI at the top two levels should be written down in the same format before it is approved, so that no one can later argue about what it meant.
| Definition Field | What It Fixes | Illustration for a Cost Synergy KPI |
|---|---|---|
| Definition and source | What is counted and where the data comes from | Annualised reduction in operating expense, taken from the general ledger |
| Baseline | The starting point agreed before closing | Combined pre-deal cost base for the affected functions |
| Target and date | The commitment from the deal case | Full run-rate by month twenty-four |
| Owner | The one person accountable for the outcome | Integration director, with functional heads as contributors |
| Thresholds | When amber and red apply | Amber at 10 per cent behind plan; red at 20 per cent |
| Response | What happens on breach | Red for two reviews escalates to the executive sponsor |
Financial KPIs: Synergies and Integration Cost
Financial KPIs carry the most weight because the purchase price was justified by them. Three measures matter.
Revenue synergies track whether cross-selling, geographic expansion and combined products produce incremental revenue. Typical indicators include new customers won across the merged markets, revenue from combined offerings and market share in target regions. Revenue synergies are slower and less certain than cost synergies, so they need leading indicators to give early warning.
Cost synergies track operating expense reductions, procurement savings and technology rationalisation. The KPI should distinguish between synergies identified, synergies actioned and synergies visible in the profit and loss account. Only the last counts as realised.
Integration cost tracks the one-off spending required to achieve the synergies: systems work, restructuring, retention payments and advisers. It must be measured against the budget approved in the deal case, because overspending on integration erodes the same value the synergies were supposed to create.
Worked Example: Reading a Synergy Dashboard at Month Twelve
Consider an illustrative acquisition whose business case promised AED 40 million of annual run-rate cost synergies by the end of month twenty-four, at a one-off integration cost of AED 30 million. The plan expects 60 per cent of the run-rate, AED 24 million, by month twelve.
At month twelve the dashboard shows AED 31 million of synergies actioned, AED 22 million visible in the ledger at annual run-rate, and AED 21 million of integration cost spent. On the activity measure the programme looks ahead of plan. On the outcome measure it is AED 2 million behind. Integration spending stands at 70 per cent of budget while realised synergies stand at 55 per cent of target.
The useful question is why AED 9 million of actioned savings has not reached the ledger. The answer may be timing, such as notice periods on supplier contracts, or leakage, such as roles removed in one unit and rehired in another. Each answer leads to a different intervention. A dashboard that showed only actioned synergies would not have raised the question.
Operational and Customer KPIs
Operational KPIs protect the business while it is being changed. Milestone completion measures whether system migrations, legal entity consolidations and process alignment are progressing on the integration roadmap. These are activity measures, which is why they sit below outcome measures in importance, but they are leading indicators of when synergies can be realised.
Customer continuity KPIs are among the most important early signals. Acquisitions disrupt service when teams change, systems migrate and account managers leave. Customer retention, service levels and satisfaction scores should be tracked from Day One against the pre-deal baseline for both businesses, with particular attention to the largest accounts. A lost key customer can cancel a year of cost synergies.
Supplier continuity deserves the same attention. Key suppliers may hold change-of-control rights, revisit credit terms or test the new owner on price. Tracking renewal dates, credit limits and delivery performance for the largest suppliers gives the steering committee warning before a commercial issue becomes an operational one. Operational KPIs rarely justify the deal. They protect the conditions in which the deal’s value can be earned.
People KPIs: Retention, Engagement and Workforce Obligations
Integration depends on people who know how both businesses work. Retention of critical talent should be measured against a named list agreed before closing, not against overall turnover, which can look healthy while the five people who matter most are leaving. Engagement indicators, such as participation in integration initiatives and pulse survey results, show whether the workforce believes in the combined organisation.
In UAE integrations, people KPIs should also cover regulatory workforce obligations. Onshore private-sector employers that fall within the Emiratisation requirements must continue to meet them as headcount is restructured, and visa and work permit transfers between entities must be completed without gaps. These are compliance outcomes with direct financial consequences, and they belong on the integration dashboard.
Governance KPIs: Decision Speed and Risk Closure
Integration velocity depends on how quickly decisions move through governance. Decision resolution time, measured from escalation to decision, shows whether the steering committee is enabling execution or slowing it. Decisions that sit unresolved for weeks are a leading indicator of milestone slippage.
Risk KPIs track whether identified integration risks are being closed and whether compliance obligations are met across jurisdictions. In the UAE these commonly include licence amendments and entity consolidations across onshore and free zone authorities, Corporate Tax registration and any tax group changes under Federal Decree-Law No. 47 of 2022, and any conditions attached to merger clearance under the Competition Law. Each should have an owner and a completion date.
Connecting KPIs to Governance and Consequence
Measurement without governance produces information without action. Each KPI should have one accountable owner, a threshold that defines amber and red, and a defined response when the threshold is breached. The integration steering committee should review the dashboard on a fixed cadence, monthly at minimum and more often in the first hundred days.
The review should follow a consistent order: outcome KPIs first, then leading indicators that explain them, then decisions required. Narrative should explain variance, not replace it. When a KPI remains red for two consecutive reviews, the issue should move to the executive sponsor or board with a recommendation, not another update.
Original Analysis: The Integration Signal Matrix
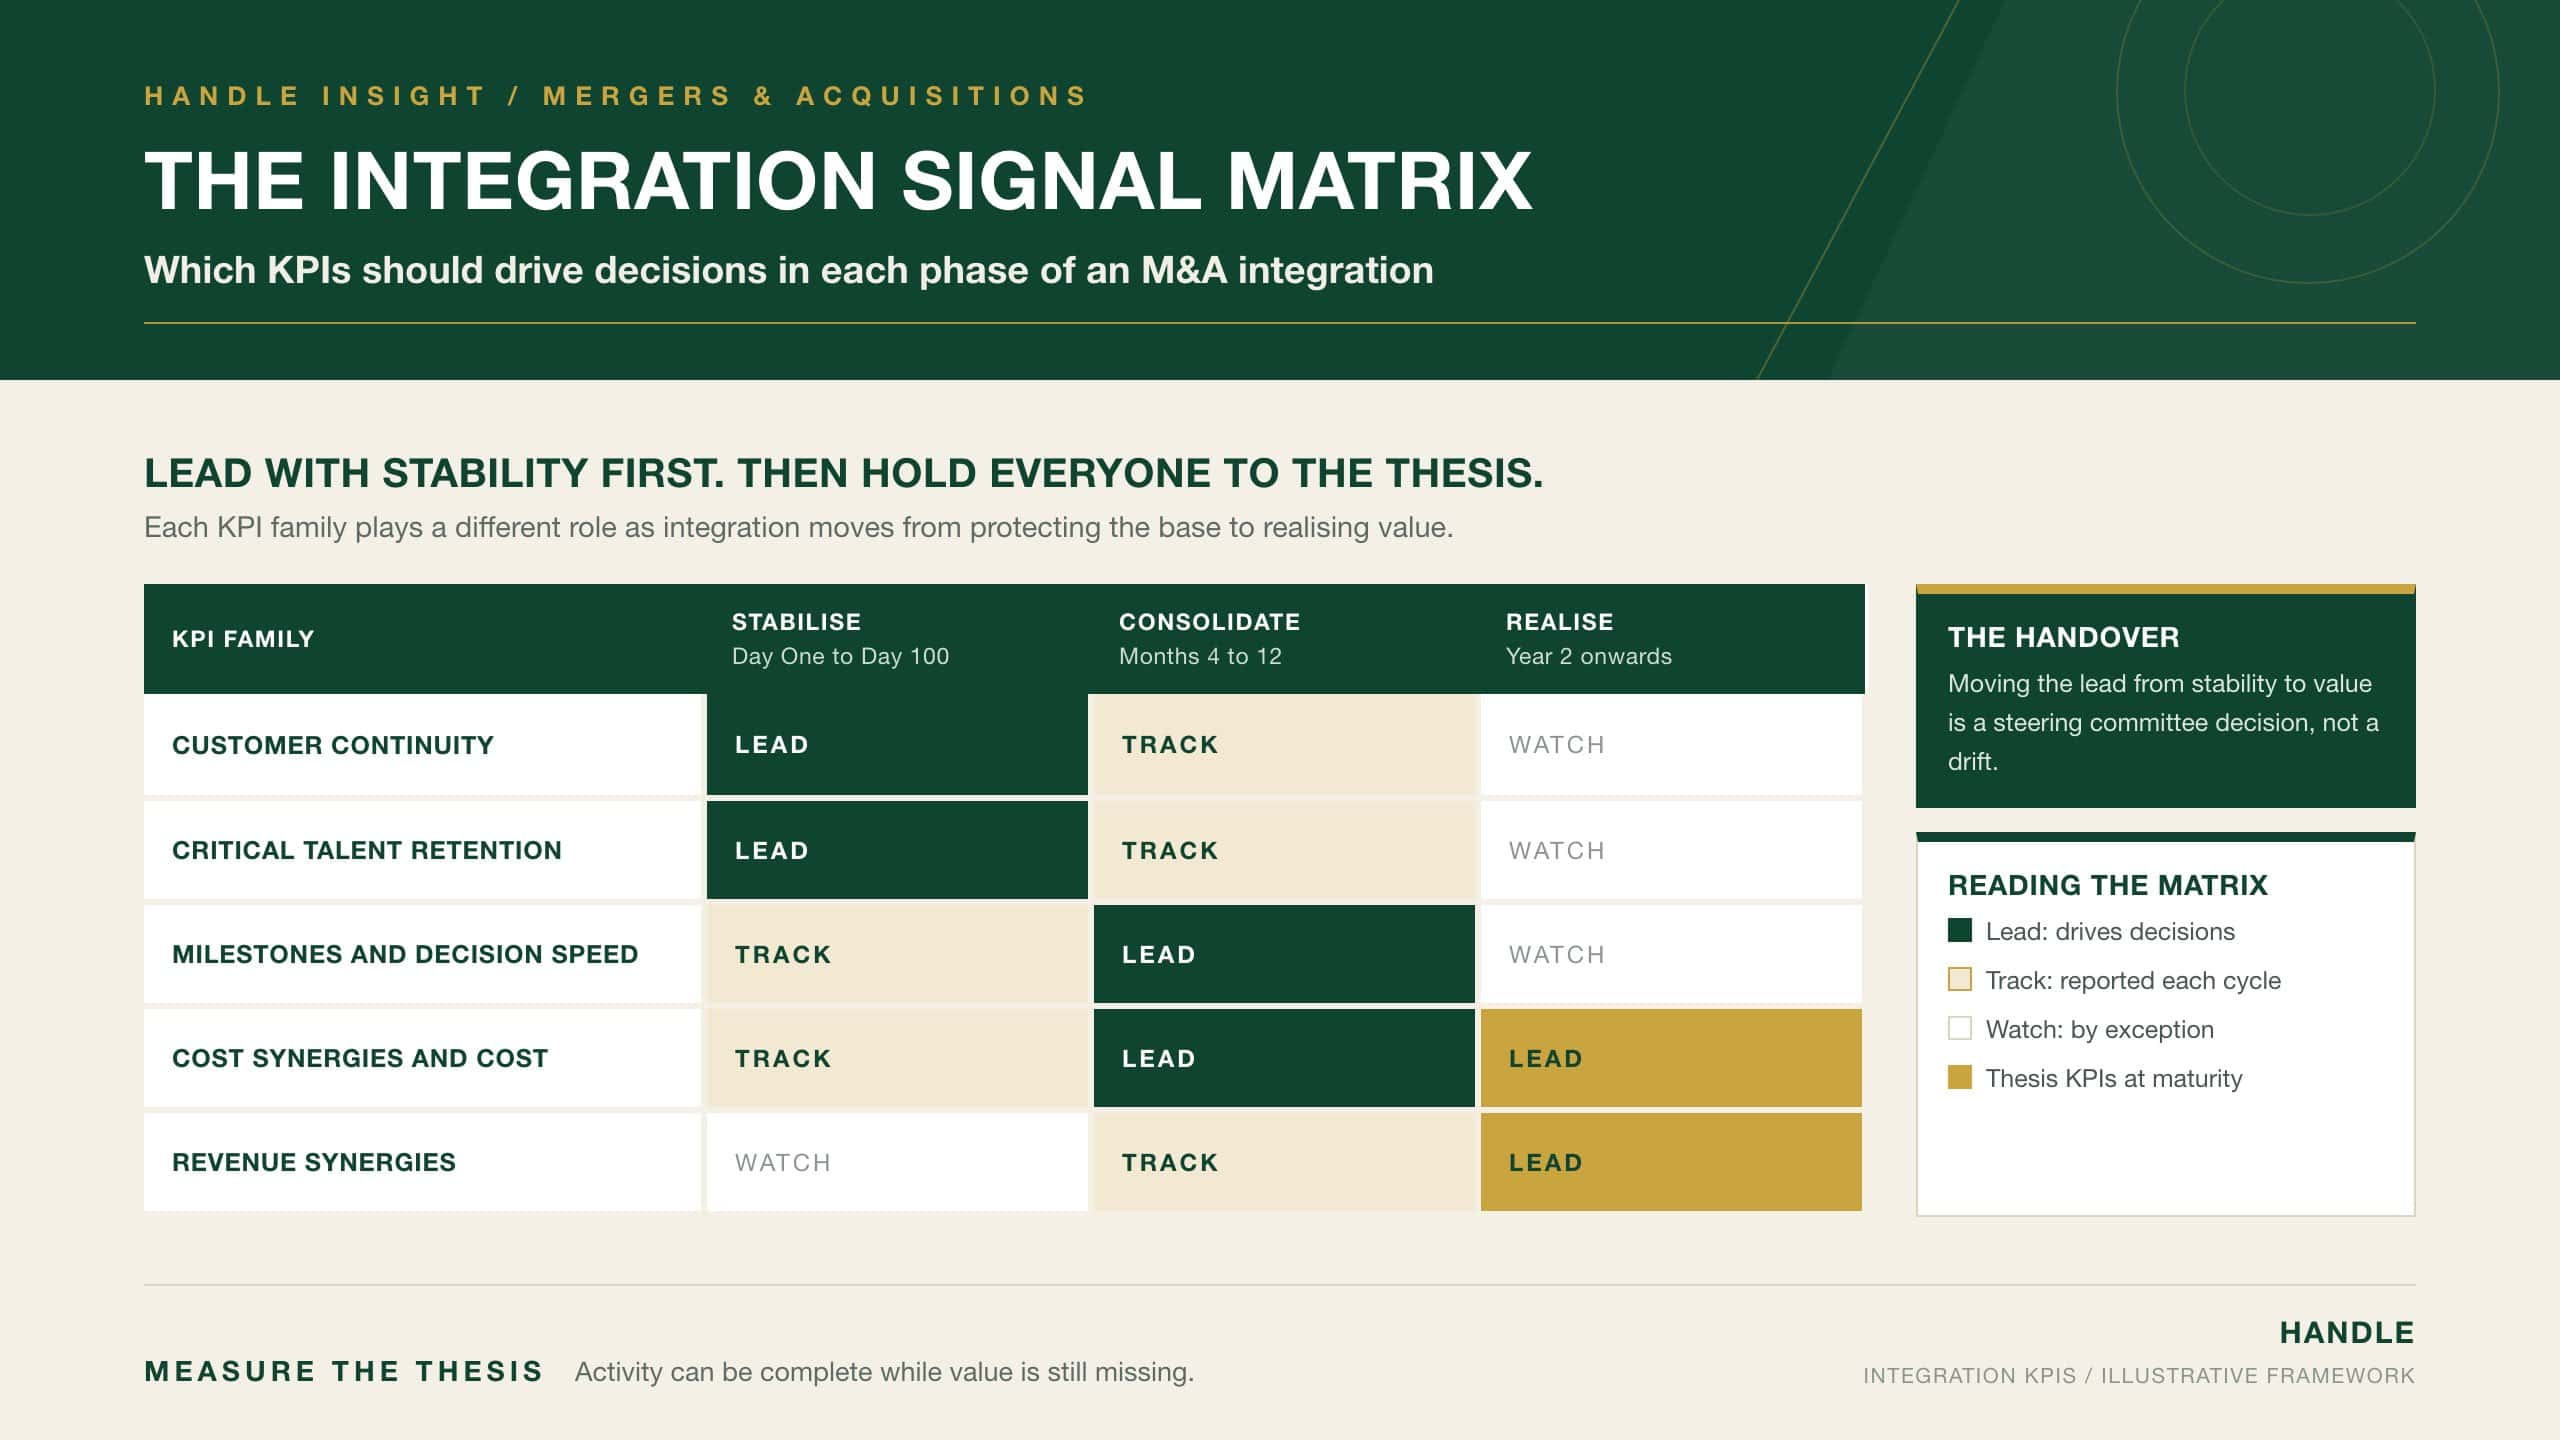
The right KPI set changes as integration progresses. Early phases are about stability, later phases about value. The Integration Signal Matrix assigns each KPI family a role in each phase: lead, track or watch. Lead KPIs drive steering committee decisions in that phase. Track KPIs are reported but rarely decisive. Watch KPIs are monitored by exception.
| KPI Family | Stabilise (Day One to Day 100) | Consolidate (Months 4 to 12) | Realise (Year 2 Onwards) |
|---|---|---|---|
| Customer continuity | Lead | Track | Watch |
| Critical talent retention | Lead | Track | Watch |
| Milestones and decision speed | Track | Lead | Watch |
| Cost synergies and integration cost | Track | Lead | Lead |
| Revenue synergies | Watch | Track | Lead |
The matrix prevents two opposite errors. Programmes that lead with synergies on Day One can damage the customer and talent base the synergies depend on. Programmes that keep leading with stability in year two never hold anyone to the business case. The handover from stability to value should be an explicit steering committee decision.
Common Integration KPI Failures
- Measuring activity completed instead of value realised, so the programme reports success while the business case slips.
- Defining synergies after closing, which allows targets to be reset to whatever is being achieved.
- Tracking overall staff turnover instead of the named individuals the deal depends on.
- Ignoring integration cost, so synergies are bought at a price the deal case never approved.
- Assigning KPIs to committees or workstreams rather than to one accountable person.
- Keeping the same dashboard throughout, so stability measures dominate long after value should have taken over.
Each failure weakens the link between the price paid and the value delivered. Disciplined measurement keeps that link visible.
Conclusion
Integration KPIs exist to show whether the value underwritten in the transaction thesis is becoming real. They should be derived from the business case, defined with finance before closing, and assigned to single owners with thresholds that trigger action. Financial measures must separate synergies identified, actioned and realised, and must be read against integration cost. Customer, talent, operational and governance measures protect the base on which value depends, and in the UAE they must include workforce, licensing, tax and competition obligations. The emphasis must shift deliberately from stability to value as the programme matures. A dashboard that reports activity will always look healthy. A dashboard that reports the thesis will show where intervention is needed. The deal sets the opportunity. Measurement decides whether it is captured.


