

Every acquisition model contains a synergy line. Very few contain a plan for earning it. Operational synergy planning is the discipline that turns the cost, capacity and capability gains promised in the deal case into specific programmes, owners, dates and audited numbers. Within Post-Merger Integration, it is the workstream that decides whether the premium paid for a business is recovered or quietly written off. The difficulty is rarely identifying where duplication exists. Two procurement teams, two warehouses and two finance functions are visible on the first day. The difficulty is converting that visibility into changes that survive contact with customers, suppliers, employees and regulators, and then proving that the savings are real rather than reallocated. A synergy is not delivered when it is announced. It is delivered when it appears in the profit and loss account and stays there.
What Is Operational Synergy Planning?
Operational synergy planning is the structured process of defining, sizing, sequencing and governing the efficiency and capability gains that arise when two organisations combine their operations. It covers procurement, supply chain, manufacturing, facilities, shared services and technology, and it connects each initiative back to the investment thesis that justified the price.
It differs from general cost reduction in one important respect. A cost programme asks what can be saved. A synergy programme asks what can be saved only because the two businesses are now under common ownership, and what that saving is worth relative to what was paid. That distinction keeps the programme honest. Savings that either company could have achieved alone are not synergies. They are performance improvements, and they should not be used to justify the premium.
Why Synergy Projections Fail After Closing
Synergy estimates are prepared under constraints. Before signing, the buyer has limited access to the target, limited time and an incentive to support the price. Estimates are therefore built top-down, often as a percentage of the combined cost base, and validated against benchmarks rather than against the operations that will actually change.
After closing, three things erode those estimates. First, the baseline moves: costs that were assumed to be duplicated turn out to serve different customers or regulatory requirements. Second, delivery takes longer than modelled because contracts, leases and employment arrangements have notice periods and consent requirements. Third, dis-synergies appear: customers leave because of service disruption, key staff resign, and suppliers reprice when they lose volume elsewhere in the group.
None of these failures is unusual. They are the predictable result of treating the deal-model figure as a target rather than as a hypothesis that must be tested and rebuilt bottom-up after closing.
How Operational Synergies Are Classified
Operational synergies fall into three categories. Each has a different source, timing profile and evidence standard, and they should not be reported as a single number.
| Category | Typical Sources | Timing | Evidence of Delivery | Principal Risk |
|---|---|---|---|---|
| Cost reduction | Supplier consolidation, facility closures, removal of duplicate roles and systems | Six to twenty-four months | Lower run-rate cost in the general ledger against a locked baseline | Savings reappear elsewhere in the cost base |
| Operational efficiency | Process standardisation, automation, better asset utilisation | Twelve to thirty-six months | Unit cost, cycle time or capacity per employee improves | Gains absorbed by volume growth and never measured |
| Capability expansion | Combined distribution, shared technology, broader product range | Eighteen months and longer | New capacity or reach that neither business had alone | Treated as a cost saving and over-credited |
The classification matters for governance. Cost synergies can be tracked monthly against a ledger baseline. Efficiency and capability synergies need operational metrics, and they should carry a lower confidence weighting until the metrics move.
From Deal Thesis to Integration Workstreams
The investment thesis states how the combined enterprise will outperform the two businesses operating separately. Synergy planning translates that thesis into workstreams, each with a functional scope, an accountable leader, a financial target and a delivery calendar.
If the thesis is cost-led, workstreams concentrate on procurement, facilities rationalisation and shared services. If the thesis is growth-led, they concentrate on capacity, distribution and integrated product delivery, and cost workstreams are deliberately limited so that they do not damage the revenue base the buyer paid for.
Each workstream reports through the integration management office. The office does not run the initiatives. It holds the baseline, validates the numbers, sequences dependencies between workstreams and escalates conflicts. A procurement saving that depends on a system migration, for example, cannot be counted until the migration is scheduled.
Procurement and Supply Chain
Procurement is usually the fastest source of synergy because combined purchasing volume can be used immediately in renegotiation. The work begins with a supplier map across both businesses, identifying overlapping vendors, categories where volume can be pooled and contracts with change-of-control or exclusivity terms. Supply chain integration follows more slowly, because distribution networks and inventory policies must be redesigned without interrupting service.
Facilities and Operational Infrastructure
Overlapping sites, warehouses and production lines offer large savings but carry the highest continuity risk. Consolidation decisions should be tested against capacity under peak demand, regulatory licensing of the receiving site and customer service commitments, not only against fixed-cost savings.
Shared Services and Technology
Finance, human resources, legal operations and IT are commonly combined into shared service models. The savings depend on process standardisation and system consolidation. Where the two businesses run different enterprise platforms, the technology roadmap sets the pace of the entire shared services programme.
A Worked Example: Pricing the Synergy Case
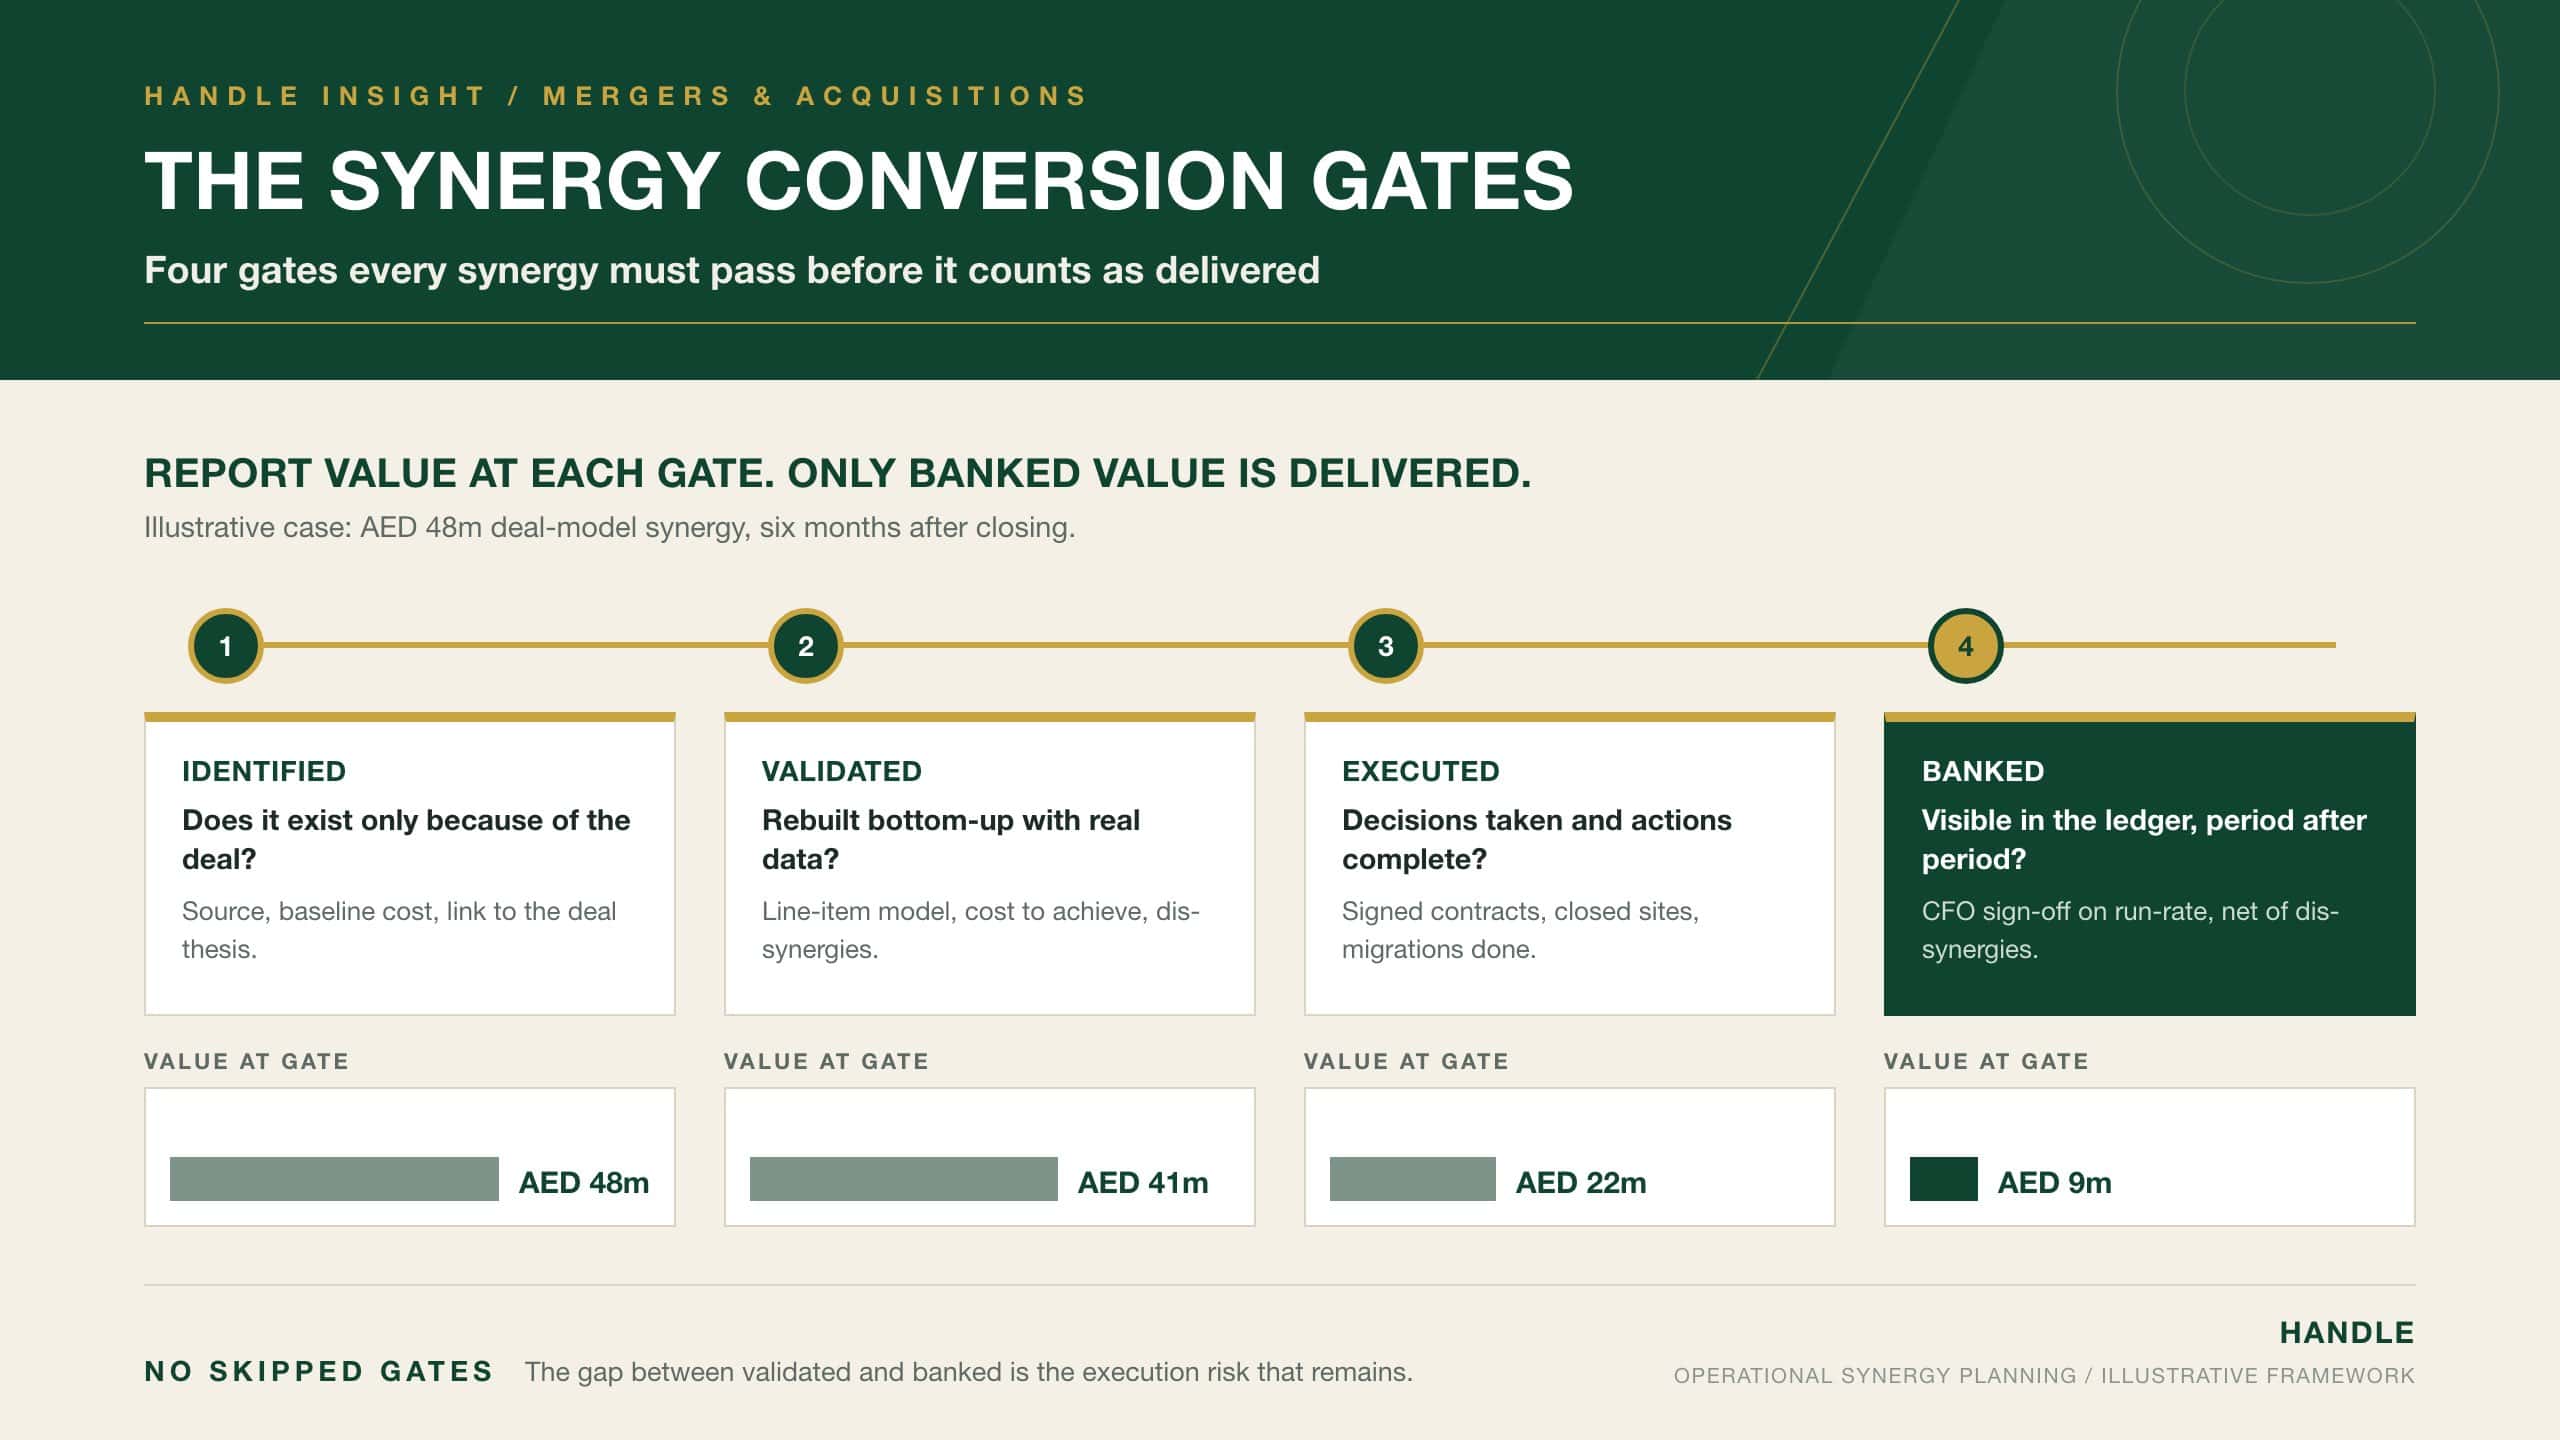
Consider an illustrative acquisition in which the combined operating cost base is AED 600 million. The deal model assumes run-rate operational synergies of AED 48 million, equal to eight per cent of the combined cost base, with one-off costs to achieve of AED 60 million. Six months after closing, the integration office reviews each workstream against the gates described later in this article.
| Workstream | Deal Model Target (AED m) | Validated Bottom-Up (AED m) | In Execution (AED m) | Banked Run-Rate (AED m) |
|---|---|---|---|---|
| Procurement | 20 | 18 | 12 | 6 |
| Facilities | 12 | 9 | 4 | 0 |
| Shared services | 10 | 9 | 5 | 3 |
| Logistics | 6 | 5 | 1 | 0 |
| Total | 48 | 41 | 22 | 9 |
Three findings follow. The validated case is AED 7 million below the deal model, which the board should know now rather than at the end of year two. Less than half of the validated value is in execution, so the delivery calendar needs reinforcement. And only AED 9 million has reached the ledger. If the programme also identifies AED 3 million of dis-synergy from customer attrition, the net banked figure is AED 6 million. At that pace, the AED 60 million cost to achieve is recovered later than the deal case assumed, and the return on the premium falls accordingly. The numbers are illustrative. The discipline of separating each stage is not.
The UAE Dimension: Workforce and Competition Constraints
For transactions involving UAE operations, two legal constraints shape the synergy timetable.
The first is employment. Onshore employment is governed by Federal Decree-Law No. 33 of 2021 on the Regulation of Labour Relations, while the DIFC and ADGM apply their own employment regimes. Role consolidation therefore requires attention to contractual notice periods, end-of-service gratuity, visa and work permit cancellations and any applicable Emiratisation obligations. These are not obstacles to restructuring, but they carry costs and lead times that belong in the synergy model, not in a footnote.
The second is competition law. Under the UAE Competition Law, Federal Decree-Law No. 36 of 2023, transactions that meet the notification thresholds require clearance before completion. Until clearance is obtained, the parties must continue to operate independently. Integration planning may proceed, but joint pricing decisions, supplier consolidation and the exchange of competitively sensitive information should be confined to properly structured clean team arrangements. Synergy capture that begins too early can expose the parties to gun-jumping risk.
Original Analysis: The Synergy Conversion Gates
Most synergy reporting presents a single number: the amount delivered to date. That number conflates estimates, commitments and results. The Synergy Conversion Gates separate them. Every initiative must pass through four gates in order, and value is reported at each gate separately.
| Gate | Question | Evidence Required | Accountable Owner |
|---|---|---|---|
| 1. Identified | Does the opportunity exist only because of the combination? | Source, baseline cost and logic linked to the deal thesis | Integration office |
| 2. Validated | Has the value been rebuilt bottom-up with operational data? | Line-item model, cost to achieve, dis-synergy estimate, legal constraints | Workstream leader with finance |
| 3. Executed | Have the decisions been taken and the actions completed? | Signed contracts, closed sites, completed migrations, notified employees | Workstream leader |
| 4. Banked | Is the saving visible in the ledger against a locked baseline for consecutive periods? | Finance sign-off on run-rate, net of dis-synergies and reinvested costs | Chief financial officer |
The gates impose two rules. An initiative cannot skip a gate, and only Gate 4 value may be reported to the board or to lenders as delivered. The gap between Gate 2 and Gate 4 is the honest measure of execution risk remaining in the programme.
How Should Synergies Be Sequenced Against Continuity Risk?
Not every synergy should be pursued at the same speed. Initiatives differ in value, in the risk they pose to revenue and in their dependence on other workstreams. A practical sequence starts with changes that are high in value and low in customer exposure, such as indirect procurement and duplicate corporate costs. It then moves to changes that require system or process readiness, such as shared services consolidation. Site closures, supply chain redesign and customer-facing changes come last, once service levels are stable and contingency plans are tested.
Each initiative should carry a continuity test before execution: what happens to customers, regulatory licences and supplier commitments if the change goes wrong, and how quickly can it be reversed. Where the answer is unclear, the initiative is not ready. Speed recovers value sooner. Sequencing ensures there is still value to recover.
Governance That Sustains Delivery
Synergy governance works on a fixed rhythm. Workstreams review progress weekly against milestones. The integration office consolidates monthly, reconciling gate values to the general ledger. The steering committee meets monthly or quarterly to approve trade-offs, release cost-to-achieve budgets and intervene where initiatives stall.
Once integration ends, the savings must be protected. Budgets for the combined business should be set on the post-synergy cost base, and functional leaders should be measured against it. Without that step, costs drift back within two or three budget cycles and the programme leaves no lasting trace.
Common Failures in Operational Synergy Planning
- Treating the deal-model synergy figure as a fixed target instead of rebuilding it bottom-up within the first hundred days.
- Reporting identified or committed savings as delivered, which gives the board false comfort and delays corrective action.
- Ignoring dis-synergies such as customer attrition and supplier repricing, so that gross savings overstate the real gain.
- Failing to lock the cost baseline, which allows savings to be offset by unrelated cost growth without anyone noticing.
- Underestimating the cost and lead time of workforce changes, including notice, gratuity and visa processes in the UAE.
- Beginning operational integration before competition clearance, creating regulatory exposure that outweighs the early saving.
- Consolidating facilities on cost grounds alone without testing peak capacity and service commitments.
Each of these failures arises from the same cause: confusing the existence of an opportunity with the delivery of a result.
Conclusion
Operational synergy planning converts the efficiency promised in an acquisition into results that can be measured and defended. It begins by classifying synergies by source and timing, rebuilds the deal-model estimate bottom-up after closing, and assigns every initiative to a workstream with an owner, a budget and a calendar. In the UAE, workforce rules and merger control shape when and how operational changes can be made, and both belong in the plan from the outset. The Synergy Conversion Gates give the board a single discipline for reading progress: identified, validated, executed and banked are different states and must be reported separately. The premium paid for a business is recovered only at the final gate. Everything before it is still risk. Planning determines the target. Governance determines the result.


