

Acquisition premiums are paid on the strength of synergy estimates, but value is created only when those estimates become cash. The gap between the two is mostly a matter of timing. Cost savings arrive later than modelled, revenue benefits arrive later still, and integration costs arrive first. Within Valuation & Synergy Analysis, synergy timeline and realization models translate a headline synergy number into a schedule: when each benefit starts, how quickly it builds, what it costs to unlock and how much of it is likely to arrive at all. That schedule decides whether the price paid is justified, whether the financing can be serviced and whether management can be held to account. A synergy without a date is not a synergy. It is an assumption.
Why Timing Decides the Value of Synergies
A synergy estimate is usually expressed as a run-rate: the annual benefit once integration is complete. Run-rate figures are useful for comparing deals, but they say nothing about how long it takes to get there. Two acquisitions with the same AED 100 million run-rate can be worth very different amounts if one reaches it in twelve months and the other in four years.
Timing affects value in three ways. First, money received later is worth less today, so a delay reduces the present value of every benefit. Second, integration costs are front-loaded, which means early years can show a net cost rather than a gain. Third, in leveraged transactions, debt service begins at closing, and covenant headroom may depend on synergies that have not yet arrived.
For these reasons, the synergy case presented to a board or a lender should never be a single number. It should be a schedule, by category and by year, with the costs required to deliver it.
The Three Phases of Synergy Realisation
Immediate efficiencies. Some benefits can be captured within months of closing because they require decisions rather than transformation: removing duplicated senior roles, consolidating advisers, insurers and auditors, renegotiating procurement contracts using combined volume, and centralising treasury. These benefits are relatively certain and provide early evidence that the integration plan is working.
Operational integration. The largest share of cost synergies usually comes from structural changes: consolidating technology platforms, rationalising facilities and supply chains, and aligning sales and support organisations. These take one to three years in many integrations, require significant one-off cost and carry operational risk if executed too quickly.
Strategic and revenue synergies. Cross-selling, combined product offerings and entry into new markets depend on customer behaviour, not only on management action. They tend to build slowly, often over several years, and are the least certain category.
Which Realisation Model Fits Which Synergy?
Different synergies accumulate in different shapes. Applying a single curve to all of them, usually a straight line, is one of the most common modelling errors.
| Model | Shape Over Time | Typical Synergies | Main Risk |
|---|---|---|---|
| Linear | Benefits build steadily in equal increments | Procurement savings, phased headcount changes, gradual site consolidation | Overstates early benefits where actions are lumpy |
| Step-change | Little benefit until a milestone, then most of it at once | Technology platform migration, facility closure, licence consolidation | A delayed milestone delays the entire benefit |
| S-curve | Slow start, acceleration, then plateau | Cross-selling, product integration, market expansion | Plateau reached later or lower than planned |
The choice of model should follow the action that unlocks the synergy. If the benefit depends on switching off a legacy system, the curve is a step, and the date of the switch-off is the key assumption. If it depends on customers adopting a new combined offer, the curve is an S, and adoption rates are the key assumption.
Building the Timeline From the Bottom Up
Reliable timelines are built from specific actions, not from top-down percentages. The process has four parts.
Baseline. Establish the cost and revenue base of both businesses in the same format, so that overlaps are visible and the starting point for measurement is agreed.
Action inventory. List every action required to deliver each synergy, with an owner, a cost and a dependency. A procurement saving might depend on contract expiry dates; a facility consolidation might depend on lease terms and regulatory approvals.
Milestones. Convert actions into milestones with dates: system migration completed, contracts consolidated, site closed, integrated sales offer launched. Each milestone is linked to the synergy it unlocks and the realisation model that applies.
Constraints. Identify the factors that limit speed. In the UAE, transactions that require merger control clearance under Federal Decree-Law No. 36 of 2023 must not be implemented before clearance, so integration actions that amount to taking control must wait. Headcount synergies must respect employment law, notice and end-of-service obligations, and Emiratisation requirements for private-sector employers. Contracts with change-of-control or exclusivity clauses may delay procurement and customer synergies.
Integration Costs and Risk Adjustment
Every synergy has a cost to unlock: severance and end-of-service payments, system integration, duplicate running costs during migration, facility exit costs, rebranding and advisory fees. These costs are typically concentrated in the first eighteen months and in many integrations amount to a substantial fraction of the annual run-rate benefit. They must sit in the same schedule as the benefits, so that net value is visible year by year.
Risk adjustment follows. Not every synergy category deserves the same confidence. A practical approach assigns a probability to each category and applies it to the schedule used for valuation and financing, while management is still held to the full target.
| Synergy Category | Illustrative Confidence Weighting | Use in Pricing and Financing |
|---|---|---|
| Duplicated corporate costs | High, for example 85 to 95 percent | Can support price and debt sizing |
| Procurement and facility consolidation | Medium to high, for example 65 to 80 percent | Can support price with a timing buffer |
| Technology platform consolidation | Medium, for example 50 to 70 percent | Price support only after milestone evidence |
| Revenue and cross-selling synergies | Low to medium, for example 25 to 50 percent | Upside; not relied on for debt service |
The weightings are illustrative and should be set from the specific evidence of each deal. The discipline that matters is to separate the synergies a buyer is prepared to pay for from those it hopes to achieve.
A Worked Example: Run-Rate Versus Realised Value
Consider an illustrative UAE acquisition with a synergy case of AED 180 million a year at run-rate: AED 120 million of cost synergies and AED 60 million of EBITDA from revenue synergies. One-off integration costs are AED 150 million.
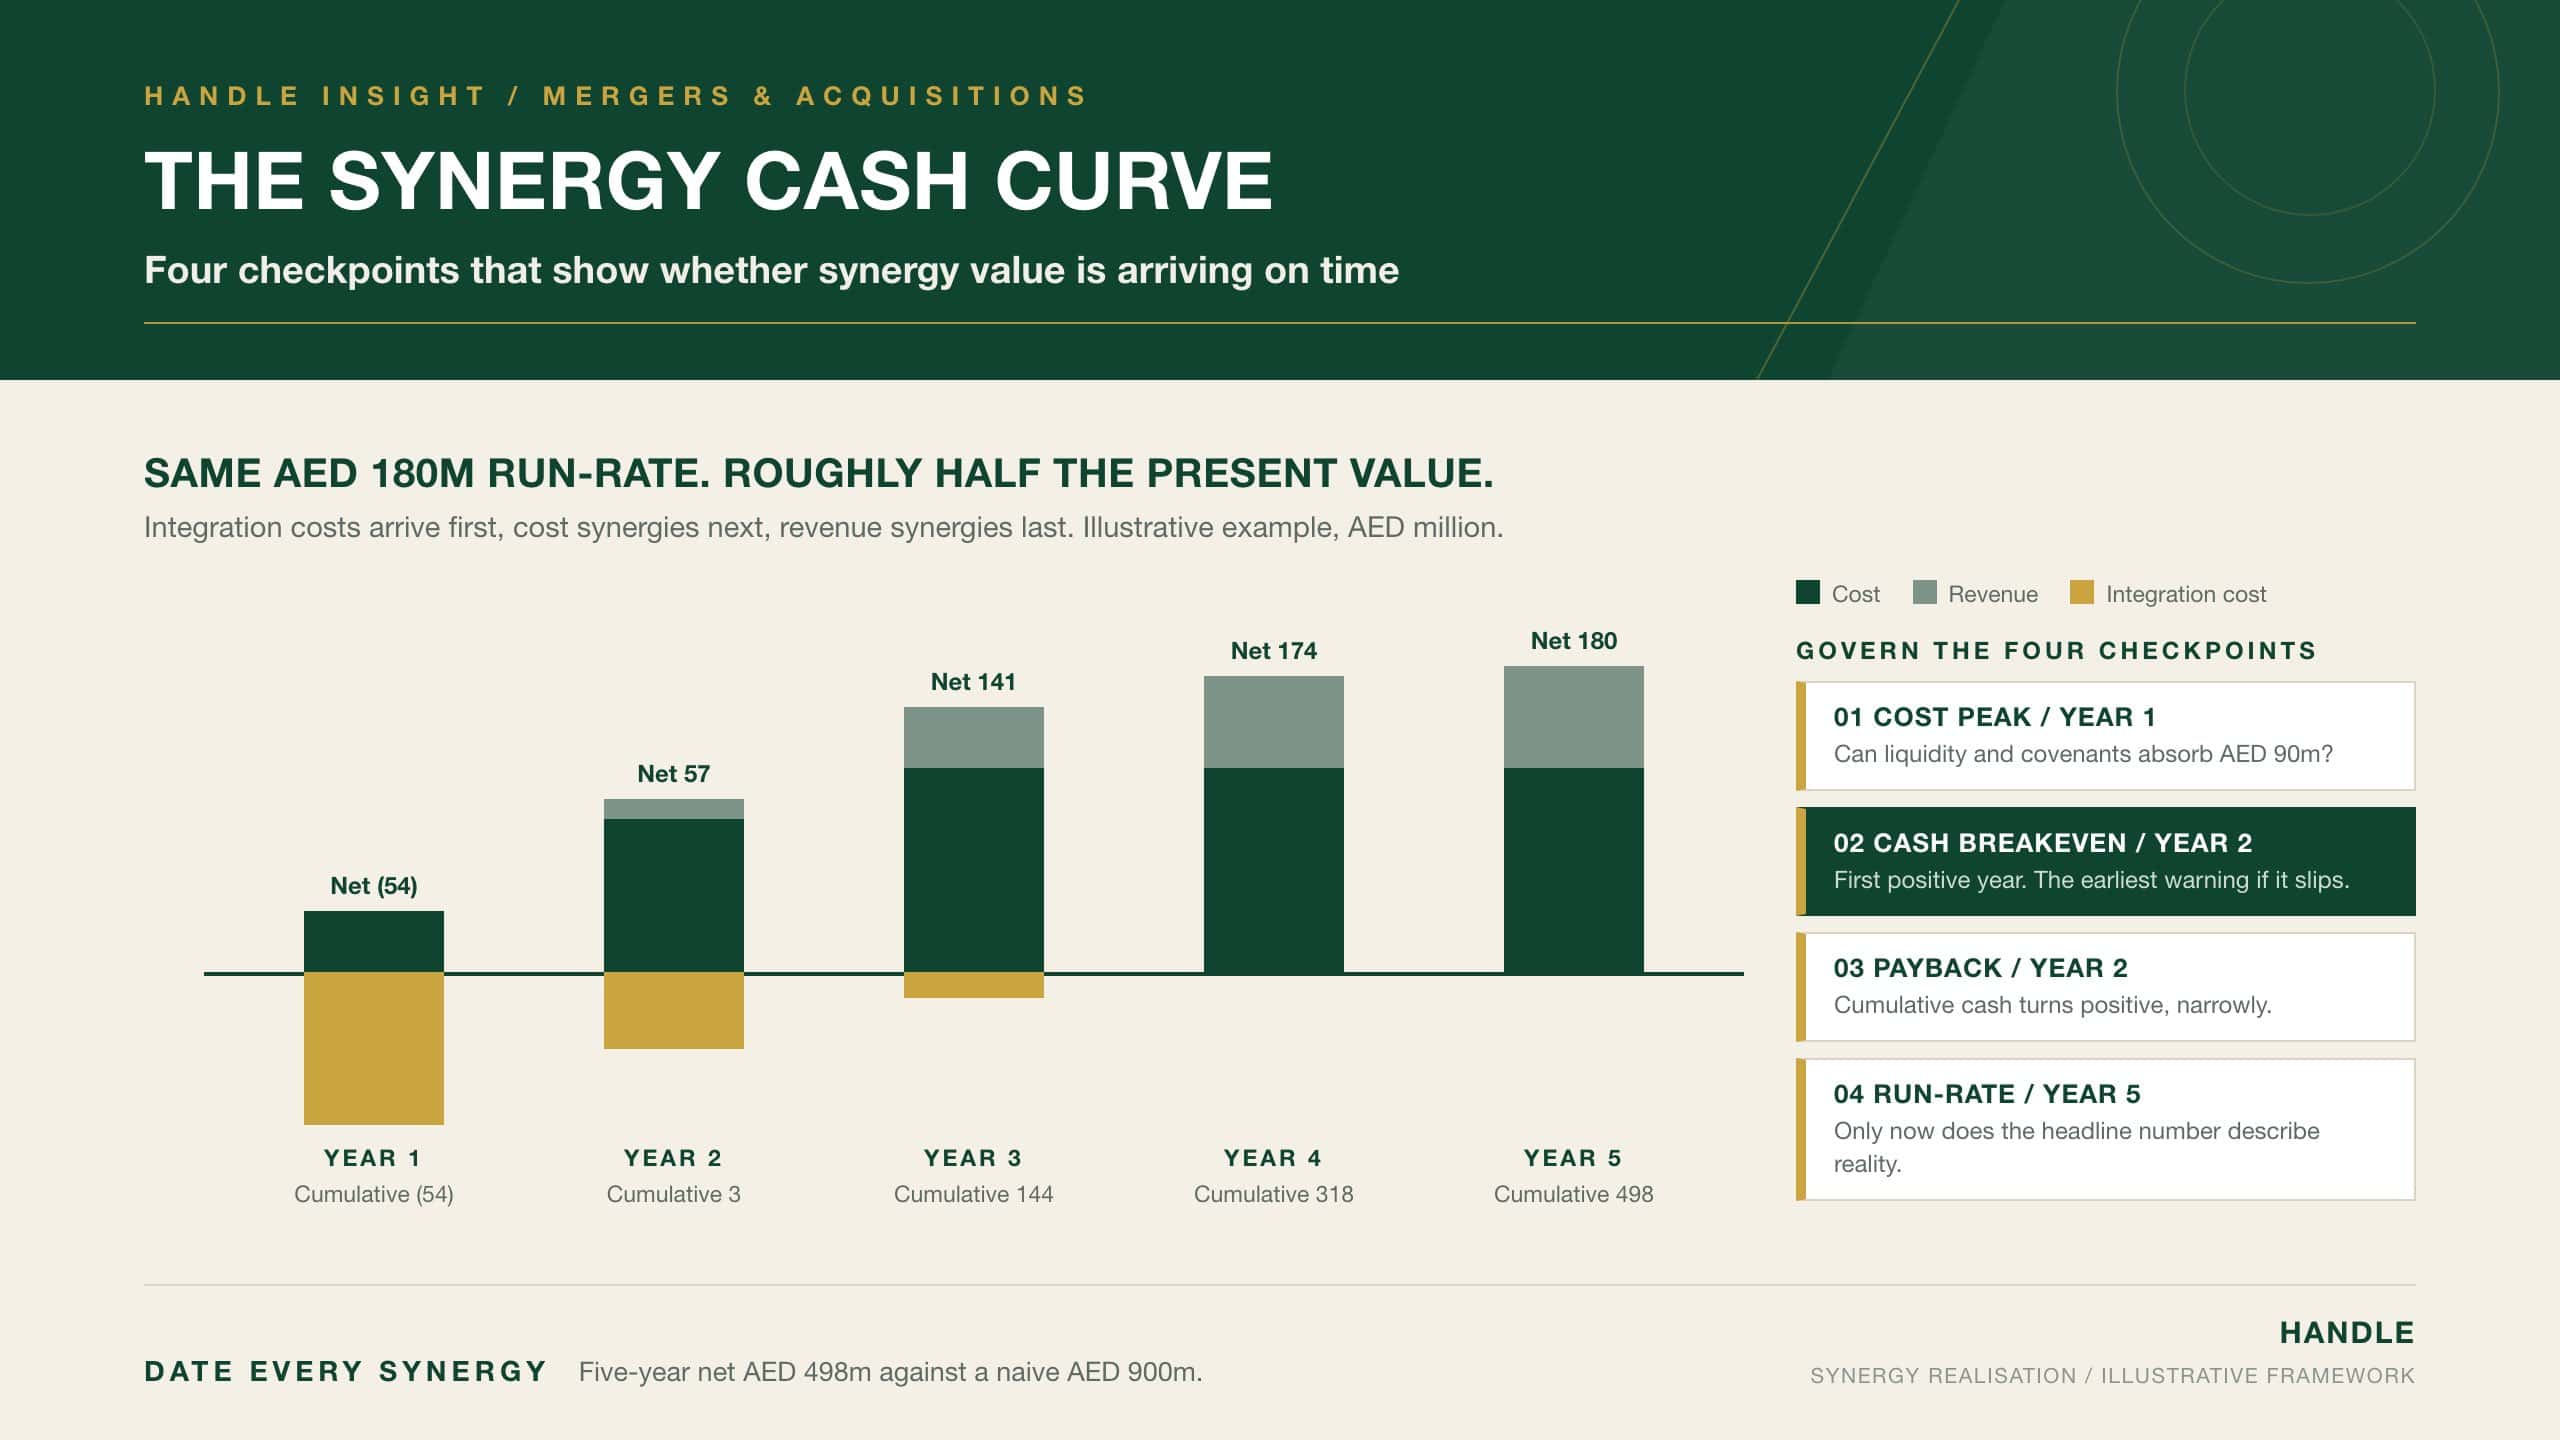
The bottom-up timeline shows cost synergies reaching 30 percent of run-rate in year one, 75 percent in year two and 100 percent from year three. Revenue synergies follow an S-curve: nothing in year one, 20 percent in year two, 60 percent in year three, 90 percent in year four and full run-rate in year five. Integration costs fall AED 90 million in year one, AED 45 million in year two and AED 15 million in year three.
| AED million | Year 1 | Year 2 | Year 3 | Year 4 | Year 5 |
|---|---|---|---|---|---|
| Cost synergies | 36 | 90 | 120 | 120 | 120 |
| Revenue synergies (EBITDA) | 0 | 12 | 36 | 54 | 60 |
| Integration costs | (90) | (45) | (15) | 0 | 0 |
| Net synergy cash | (54) | 57 | 141 | 174 | 180 |
| Cumulative | (54) | 3 | 144 | 318 | 498 |
A naive model that assumed the full AED 180 million from day one would show AED 900 million over five years. The realised schedule shows AED 498 million. Discounted at an illustrative 10 percent, the naive case is worth about AED 682 million and the realised schedule about AED 335 million, roughly half. If the premium paid was based on the naive figure, half of it has no support. The synergies are the same. Only their timing differs.
Original Analysis: The Synergy Cash Curve
The worked example produces a characteristic shape. Net synergy cash dips below zero as integration costs peak, crosses into positive territory as cost synergies take hold, and then climbs towards run-rate as revenue synergies mature. The Synergy Cash Curve uses four checkpoints on that shape to govern the integration.
Cost peak. The point of maximum integration spending, usually in the first year. The governing question is whether liquidity and covenant headroom can absorb it.
Cash breakeven. The first period in which annual net synergy cash is positive. In the example it occurs in year two. A slipping breakeven is the earliest reliable warning that the case is at risk.
Payback. The point at which cumulative net synergy cash turns positive, meaning integration costs have been recovered. In the example it also falls in year two, but only narrowly.
Run-rate. The point at which all categories reach full annual benefit. Only from here does the headline synergy number describe reality.
Each checkpoint carries a date, an owner and a reporting line to the board. Tracking the curve against these four points, rather than tracking a single run-rate target, shows early whether value is arriving on time, and gives management the chance to accelerate actions or release costs before the gap becomes permanent.
How Should Synergy Timing Shape the Financing?
In leveraged acquisitions, the synergy schedule and the debt schedule must be read together. Lenders size facilities on projected EBITDA, and covenant tests usually begin within a few quarters of closing. If those projections include synergies at run-rate, the borrower may breach its leverage covenant in the very period when integration costs peak and benefits have barely started.
Three safeguards reduce that risk. Debt should be sized on the risk-weighted schedule rather than the headline case, with revenue synergies excluded. Any contractual add-back of projected synergies to EBITDA for covenant purposes should be capped and limited in time, and the borrower should be confident it can evidence the actions behind it. Liquidity headroom should cover the cost peak with margin for a delayed breakeven. A financing structure that only works if every synergy arrives on schedule is a structure built for the best case.
Governing Realisation After Closing
A synergy model is only as good as the governance that follows it. An integration management office should own the master schedule, track milestones and synergies in the same system, and report realised benefits net of costs against the deal case. Finance should validate claimed savings against the baseline, so that benefits are not double-counted or confused with ordinary business changes. Synergy targets should be built into the objectives of named business leaders, not held centrally where no one is accountable for delivery.
Common Failures in Synergy Timeline Modelling
- Presenting a run-rate figure as if it were available from closing, which overstates value and conceals the early cash cost.
- Applying a straight-line curve to synergies that depend on a single milestone or on customer adoption.
- Omitting integration costs from the synergy schedule, so that net value and payback cannot be seen.
- Sizing acquisition debt on revenue synergies that are uncertain and slow to arrive.
- Ignoring legal constraints on timing, such as merger control clearance, employment obligations and contract consents.
- Measuring realised synergies without an agreed baseline, which allows ordinary cost movements to be reported as deal benefits.
- Holding targets centrally rather than assigning them to the business leaders who must deliver them.
Each failure turns a schedule back into an assumption. Value creation depends on reversing that.
Conclusion
Synergy timeline and realization models turn a headline synergy figure into a dated, costed schedule that can be priced, financed and managed. Immediate efficiencies arrive first, operational integration delivers most cost savings over the following years, and revenue synergies build slowly along an S-curve. Each category needs the realisation model that matches the action unlocking it, the integration cost required to deliver it and a confidence weighting that separates what a buyer will pay for from what it hopes to achieve. Legal constraints, including merger control clearance and employment obligations, set the earliest possible dates. The Synergy Cash Curve then governs delivery through four checkpoints: cost peak, cash breakeven, payback and run-rate. The worked example shows how much timing alone can change value. Run-rate is a destination. The schedule is the deal. Value arrives on a date, or it does not arrive.


