

Enterprise performance does not improve because the centre asks for more reporting. It improves when decision rights, accountability and measurement are aligned from the board to each business unit and down to the teams that execute. Cascading KPIs across business units is the mechanism that achieves that alignment. Done well, it converts a small set of enterprise outcomes into measurable control points in every unit, so that the centre can compare performance, allocate capital and intervene early. Done badly, it produces hundreds of metrics, negotiated targets and dashboards that describe activity without changing it. The difference lies in design: locked definitions, explicit line-of-sight, targets set by capital logic and a review rhythm that forces decisions. A KPI that cannot trigger action is not a control. It is commentary.
What Does Cascading KPIs Across Business Units Mean?
Cascading KPIs is the structured translation of enterprise outcomes into unit-level targets and operational drivers. It is not a list of departmental metrics copied from a corporate dashboard. Each unit receives a share of the enterprise outcome it can influence, expressed in the same measurement language as every other unit, together with the drivers it will use to deliver that share.
A cascade must achieve three things. Alignment: every unit pursues the same strategic intent without redefining success to suit its own circumstances. Comparability: the centre can compare units with confidence because definitions, thresholds and reporting periods are consistent. Actionability: every KPI sits with someone who can change it. If a metric sits beyond the unit’s control, it creates explanations rather than execution.
Why Most KPI Cascades Fail
Cascades fail for predictable reasons. Units add their own metrics until the framework becomes unreadable. Definitions drift, so that margin in one unit is calculated before shared costs and in another after them. Targets are negotiated rather than derived, so politically strong units receive softer thresholds. And reviews concentrate on presentation rather than decision, so variances are explained but not corrected.
Each failure has the same consequence: the board loses the ability to compare units and to see where capital is earning its return. At that point the cascade is no longer a control system. It is a reporting burden.
Start With a Small Set of Enterprise Control KPIs
The cascade begins at the top, with a small number of enterprise control KPIs that define what the organisation is designed to deliver. These are the metrics that drive capital allocation, risk appetite and strategic direction, and they are owned by the chief executive and the executive committee.
Enterprise control KPIs usually fall into four categories: value creation, capital efficiency, risk containment and strategic execution. Using all four prevents the cascade from becoming revenue-only. A unit can grow revenue while eroding margin, consuming working capital or increasing regulatory exposure. A balanced set of enterprise KPIs makes that trade-off visible.
Before any cascading begins, definitions are locked. Calculation methods, data sources, currency conversion rules, revenue recognition policies and reporting cut-off dates are set centrally. For groups operating across several jurisdictions, including onshore and free zone entities in the UAE, this also means applying a single convention for intra-group charges and shared costs so that unit results are comparable. Thresholds are fixed at the same time. A unit does not earn a softer target because it is complex or politically important.
How Should the Cascade Be Structured?
A cascade works when it is engineered as a hierarchy with defined layers, owners and limits rather than a free-form mapping exercise.
| Layer | Purpose | Owner | Review Cadence | Typical Ceiling |
|---|---|---|---|---|
| Enterprise KPIs | Confirm the enterprise is delivering its mandate within approved capital and risk limits | Chief executive and executive committee | Monthly, with quarterly board review | Eight to twelve |
| Business unit KPIs | Measure each unit’s contribution to enterprise outcomes | Business unit head | Monthly | Six to ten per unit |
| Driver KPIs | Track the operational levers each unit uses to control its outcomes | Functional and operational managers | Weekly | Three to five per unit KPI |
The ceilings are indicative rather than fixed rules, but the principle is firm. Too many KPIs means none are enforced. Each layer needs a defined maximum and a rule for what must be removed when something new is added.
Building Line-of-Sight Between Layers
Line-of-sight is the control that prevents metric drift. Every unit KPI must connect upward to an enterprise KPI and downward to drivers the unit controls. The mapping is documented, not implied.
Two rules keep the mapping clean. First, one enterprise KPI can cascade into several unit drivers. An enterprise margin KPI may cascade into pricing discipline, cost-to-serve, supplier renegotiation and delivery productivity, each with its own owner and threshold. Second, one unit KPI must not serve several enterprise outcomes. If a single metric is expected to improve margin, growth and risk at the same time, nobody can interpret a movement in it, and accountability collapses. Each KPI should be single-purpose with one interpretation.
A KPI should be admitted to the framework only if it links to an enterprise outcome, has a reliable data source, has a named owner, has thresholds that trigger defined action and has a review cadence. Units may track additional measures for internal improvement, but these remain monitoring metrics, not governance KPIs.
A Worked Example: Reconciling Unit Targets to the Enterprise
Consider an illustrative group with an enterprise EBITDA margin target of 18 per cent on revenue of AED 1,000 million. It has three business units with different portfolio roles. Each unit proposes its own target, and each proposal looks reasonable in isolation.
| Business Unit | Portfolio Role | Revenue (AED m) | Proposed Margin | Proposed EBITDA (AED m) | Reconciled Margin | Reconciled EBITDA (AED m) |
|---|---|---|---|---|---|---|
| Unit A | Growth engine | 400 | 22% | 88 | 22% | 88 |
| Unit B | Cash generator | 350 | 16% | 56 | 18% | 63 |
| Unit C | Turnaround | 250 | 12% | 30 | 11.6% | 29 |
| Enterprise | 1,000 | 17.4% | 174 | 18.0% | 180 |
The proposed targets fall AED 6 million short of the enterprise outcome. Rather than spreading the gap evenly, the centre applies portfolio logic. Unit B, whose role is to generate cash, has the mature cost base and pricing position to carry a higher margin, and its target is raised to 18 per cent. Unit C, in turnaround, is given a slightly lower margin target in exchange for explicit driver KPIs on cost-to-serve and working capital. The reconciled targets add up to the enterprise commitment before they are issued. A cascade that does not reconcile is a wish list.
Allocate Targets With Capital Logic, Not Negotiation
Targets should be set by a repeatable method that reflects each unit’s capacity, market exposure, capital allocation and portfolio role. A unit without working capital headroom cannot be given a growth target that requires it. A unit held to stabilise cash flow should not be measured as if it were a growth engine. Capital allocation and KPI targets move together.
The method should also define how seasonality is treated, how currency movements are handled and how one-off events are normalised. Once the method is written down, negotiation gives way to calculation, and units can predict how their targets will be set in the next cycle.
What About Shared Services and Non-Financial Outcomes?
Not every unit earns revenue. Shared service centres, technology functions and group treasury contribute to enterprise outcomes indirectly, and they are often left out of the cascade or given generic activity measures. Both responses weaken control. A shared service unit should cascade from the enterprise capital efficiency and risk containment KPIs, with drivers such as cost per transaction, service levels to operating units and control exceptions. Its targets should be reconciled in the same way as those of revenue-earning units.
Non-financial outcomes, such as safety, customer retention, regulatory compliance and talent retention, need the same discipline. Each should have a locked definition, an enterprise owner and drivers at unit level. Where a non-financial KPI cannot be connected to an enterprise outcome, it belongs in monitoring rather than governance. Every unit sits somewhere in the cascade. None sits outside it.
Embedding the Cascade in the Governance Rhythm
Cascaded KPIs work only when they drive decisions in a fixed operating rhythm.
| Forum | Focus | Decision Rights |
|---|---|---|
| Weekly unit review | Driver KPIs outside threshold: variance, cause, action, owner, deadline | Corrective action and reallocation within the unit |
| Monthly performance review | Unit KPIs against target, capital usage and risk posture | Resource decisions and escalation to the executive committee |
| Quarterly portfolio review | Unit trajectory against enterprise outcomes | Leadership change, capital reallocation, operating model redesign or exit |
Data governance sustains the rhythm. KPIs that influence capital allocation and leadership decisions must be auditable: data sources, transformations and manual overrides are controlled, and adjustments require justification and approval. A cascade will expose weaknesses in data quickly. That is useful. It forces the enterprise to build a single measurement language.
Original Analysis: The Line-of-Sight Tree
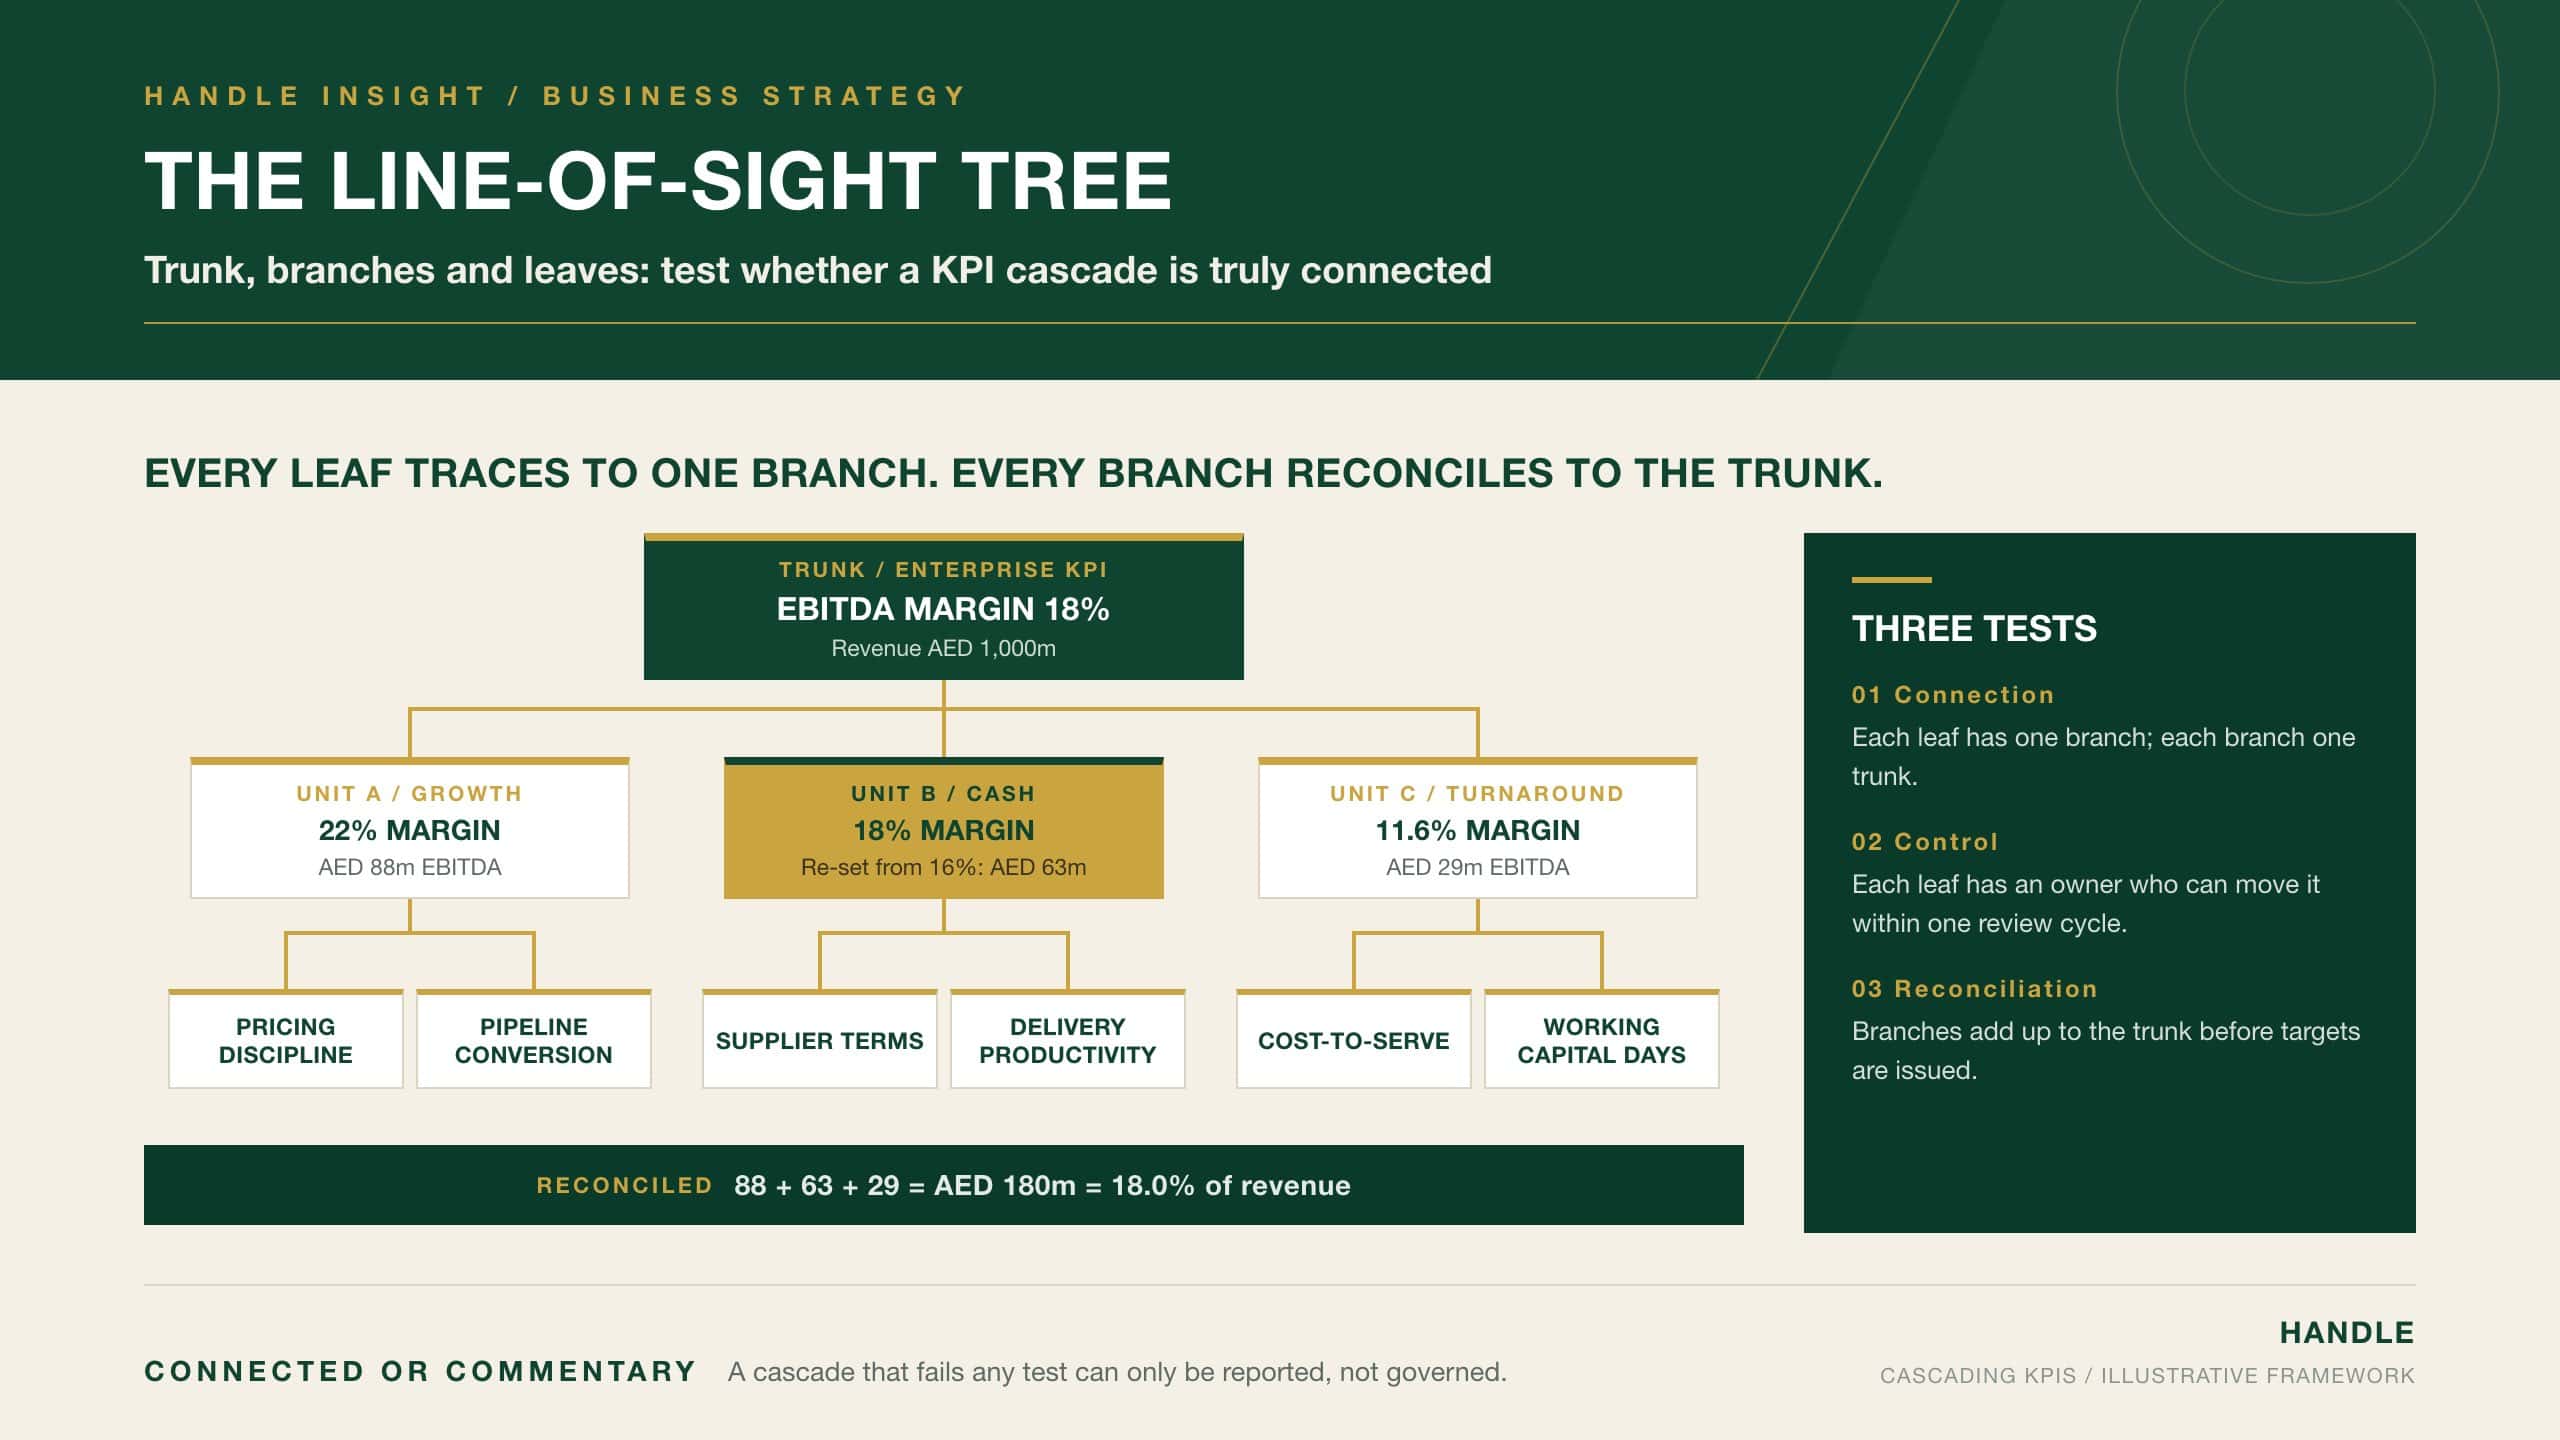
The Line-of-Sight Tree is a way of testing whether a cascade is genuinely connected. It draws every enterprise KPI as a trunk, every unit KPI as a branch and every driver KPI as a leaf. Drawing the cascade this way, on a single page per enterprise KPI, exposes problems that remain hidden in a spreadsheet of metrics. The tree is then put through three tests.
| Test | Question | Failure Signal | Remedy |
|---|---|---|---|
| Connection | Does every leaf trace to exactly one branch, and every branch to exactly one trunk? | Leaves with no branch, or branches serving several trunks | Remove vanity metrics; split dual-purpose KPIs |
| Control | Does every leaf have an owner who can move it within one review cycle? | Drivers owned by committees or set by external factors | Reassign ownership or replace with a controllable driver |
| Reconciliation | Do the branches, added together, deliver the trunk? | Unit targets that sum to less than the enterprise commitment | Re-set targets by portfolio role before issue |
The tests are applied in order. A leaf with no branch is a vanity metric and should be removed. A branch with no leaves is an outcome without levers and needs drivers before it can be managed. A trunk whose branches do not reconcile is an unfunded promise to the board. In the worked example above, the margin trunk failed the reconciliation test by AED 6 million until the targets were re-set.
The tree also gives the board a practical review tool. Rather than reading a dashboard of fifty metrics, directors can ask to see the tree for each enterprise KPI, confirm that it passes all three tests and focus discussion on the branches that are off threshold. A cascade that passes all three tests can be governed. One that fails any of them can only be reported.
Common Failures in Cascading KPIs
- Allowing units to adapt enterprise definitions, which makes cross-unit comparison unreliable.
- Negotiating targets unit by unit and never checking that they add up to the enterprise commitment.
- Assigning KPIs to units that cannot influence them, which produces explanations instead of corrective action.
- Using a single metric to measure several outcomes, so that no one can interpret its movement.
- Adding new KPIs without removing old ones, until the framework becomes too large to enforce.
- Holding reviews that present variances without assigning actions, owners and deadlines.
- Permitting manual adjustments to KPI data without approval, which undermines trust in the numbers.
Conclusion
Cascading KPIs across business units is enterprise governance expressed in measurable form. It starts with a small set of enterprise control KPIs, locks their definitions and thresholds, and translates them through business unit KPIs into drivers that managers can actually move. Targets are set by capital logic and portfolio role, then reconciled so that the units together deliver what the enterprise has committed. A fixed review rhythm turns variances into decisions, and controlled data keeps the numbers credible. The Line-of-Sight Tree gives leadership a simple test of whether the cascade is connected, controllable and reconciled. When those three conditions hold, the board can compare units, allocate capital with confidence and intervene before drift becomes failure. Performance becomes visible. Variance becomes actionable. Outcomes remain controlled.


